Historical Airfare Data Australia International Routes (2024–2025): Market Overview and Pricing Intelligence
Introduction
Historical Airfare Data Australia International Routes has become increasingly valuable for airlines, travel companies, online travel agencies, investors, tourism organizations, and aviation analysts seeking to understand how international ticket prices change across seasons, markets, airlines, and booking windows. Australia's geographic distance from Europe, North America, and many Asian destinations creates distinctive airfare dynamics shaped by capacity, fuel costs, connecting hubs, exchange rates, tourism demand, school holidays, and airline competition.
Airline Data Scraping provides a practical way to build detailed historical records from airline websites, online travel agencies, metasearch platforms, and other publicly accessible flight-booking interfaces. A properly structured dataset can preserve observations such as origin, destination, airline, cabin, departure date, return date, fare, currency, stops, flight duration, availability, baggage conditions, and collection timestamp.
Australia Europe International Route Fare Data scraping is particularly useful because European routes involve long-haul operations, multiple connecting hubs, strong seasonal variation, and significant differences between nonstop and one-stop itineraries. Routes linking Sydney, Melbourne, Brisbane, Perth, and Adelaide with London, Paris, Frankfurt, Rome, Amsterdam, Madrid, and other European gateways can therefore provide a rich environment for historical fare analysis.
Australia's international aviation market has recovered strongly following the pandemic disruption. According to Australia's Bureau of Infrastructure and Transport Research Economics (BITRE), international scheduled passenger traffic reached 45.766 million for the year ended March 2026, up 8.7% from 42.113 million a year earlier. March 2026 passenger traffic itself increased 10.9% year over year, while available seats increased 2.5%.
This combination of rising passenger demand and comparatively slower capacity growth demonstrates why historical pricing intelligence is becoming increasingly important. However, publicly available Australian aviation statistics primarily describe traffic, capacity, flights, and load factors rather than the complete transaction-level international fare history required for detailed route-price modeling. BITRE's international time-series data provides airline, country, and city-pair activity information, while fare collection requires additional sources.
Why Historical International Airfare Data Matters?
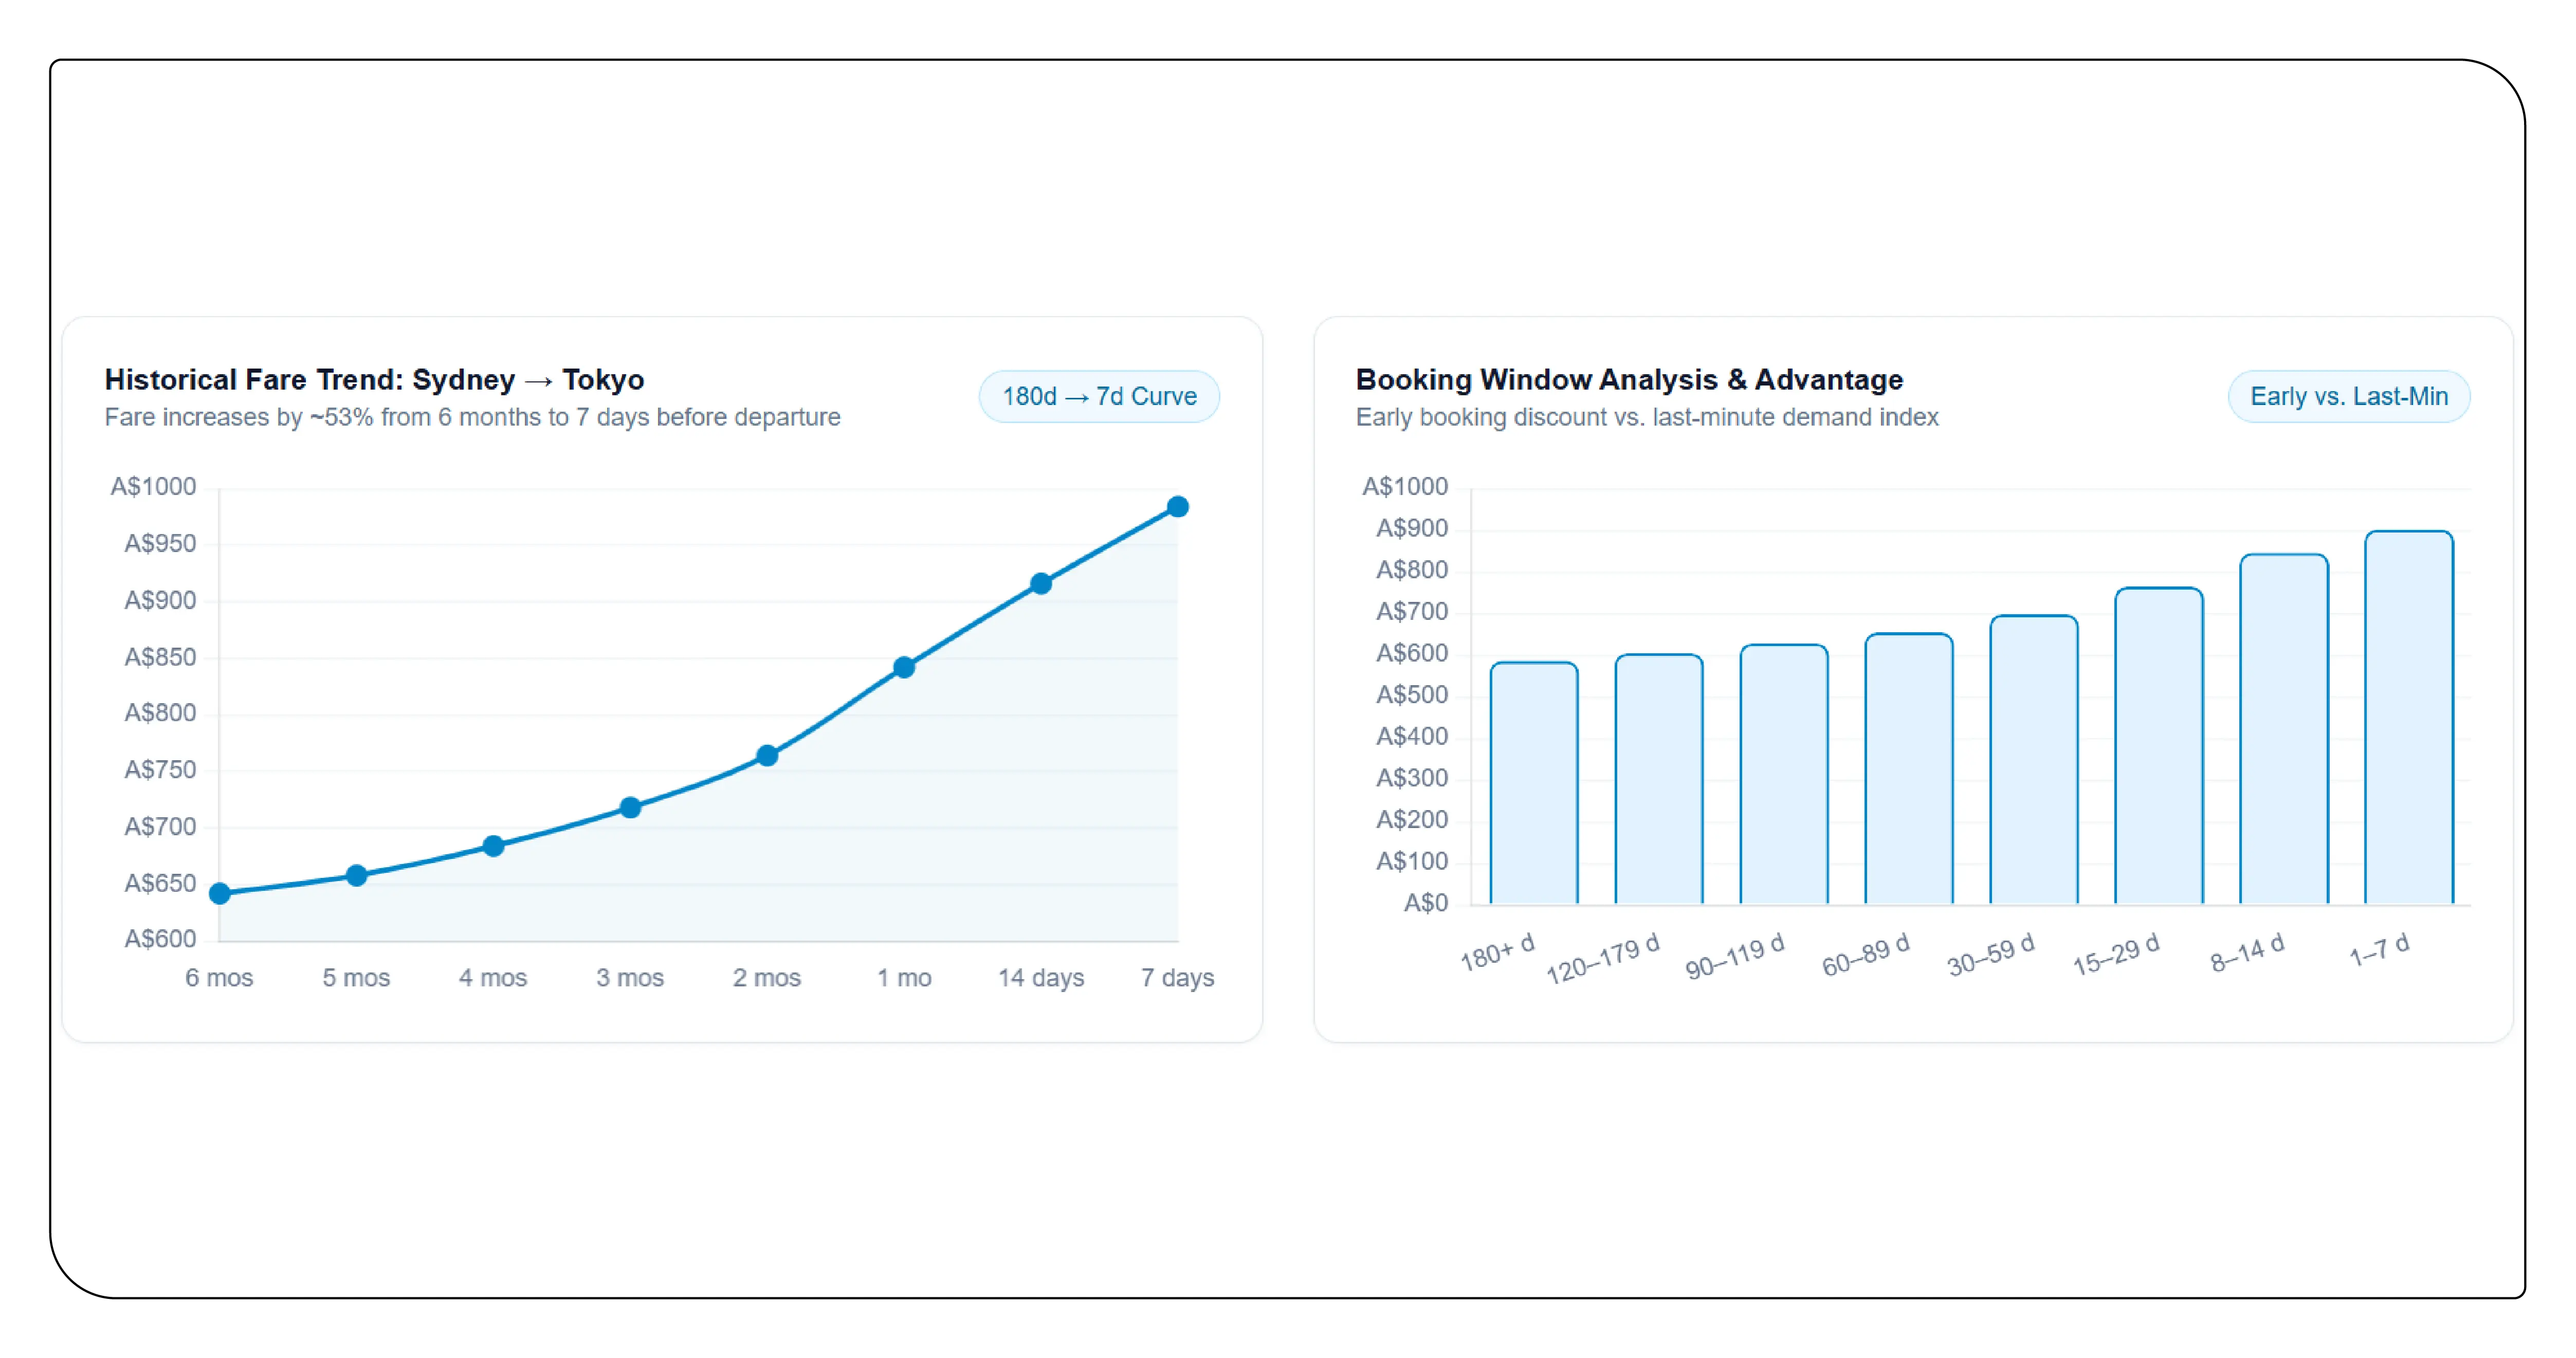
Flight Price Data Intelligence transforms individual fare observations into a structured view of pricing behavior. Instead of asking what a flight costs today, analysts can investigate how the same route behaved 7, 30, 60, or 180 days before departure and compare those patterns across seasons.
For example, a Sydney–London itinerary might show very different pricing behavior in January, April, July, and December. A historical database can identify whether prices typically rise during Australian school holidays, whether early booking provides a measurable advantage, and how aggressively airlines discount fares when additional capacity enters the market.
The value becomes greater when prices are recorded repeatedly. A single fare snapshot represents one market condition; thousands of timestamped observations reveal pricing cycles.
Extract Australia Asia International Route Fare Data to support analysis of highly active markets such as Australia–Japan, Australia–Singapore, Australia–Thailand, Australia–Indonesia, Australia–China, Australia–South Korea, and Australia–Malaysia. These routes often have different competitive structures from Europe because of shorter travel distances, higher low-cost-carrier participation on selected markets, stronger leisure traffic, and extensive connecting options.
Australia's international network is substantial. BITRE reported 62 international airlines operating scheduled services to or from Australia in January 2026, while January international passengers reached 4.620 million and available seats reached 5.610 million.
Building a Historical Fare Dataset
Global Flight Price Trends Dataset should combine fare observations with operational and market variables. Each record should ideally contain a unique route identifier, collection date, departure date, return date, airline, flight number, cabin class, fare family, currency, ticket price, taxes, baggage allowance, number of stops, connection airport, journey duration, and booking lead time.
The collection frequency depends on the analytical objective. A pricing-monitoring project may capture fares once or several times each day, while a strategic historical dataset can collect prices at predefined booking windows such as 180, 120, 90, 60, 45, 30, 21, 14, 7, and 3 days before departure.
A major advantage of structured collection is the ability to normalize currencies and remove misleading comparisons. A $900 fare and an €900 fare are not equivalent observations. Similarly, a basic economy fare without checked baggage should not automatically be compared with a flexible economy ticket containing baggage and cancellation benefits.
Illustrative Australia International Route Fare Dataset
The following table demonstrates how a route-level research dataset can be structured. The fare figures below are illustrative analytical values, not official published historical ticket prices. They show the type of numerical dataset that can be generated after systematic fare collection.
| Origin | Destination | Region | Typical Stops | Sample Avg. Economy Fare (AUD) | Sample Low Fare (AUD) | Sample High Fare (AUD) | Avg. Lead Time | Sample Demand Index | Sample YoY Fare Change |
|---|---|---|---|---|---|---|---|---|---|
| Sydney | London | Europe | 0–1 | 2,180 | 1,420 | 3,460 | 82 days | 94 | +8.4% |
| Melbourne | London | Europe | 0–1 | 2,090 | 1,390 | 3,280 | 79 days | 91 | +7.8% |
| Perth | London | Europe | 0–1 | 1,760 | 1,180 | 2,740 | 74 days | 88 | +6.2% |
| Sydney | Paris | Europe | 1 | 2,240 | 1,470 | 3,510 | 84 days | 89 | +9.1% |
| Melbourne | Rome | Europe | 1 | 2,060 | 1,350 | 3,290 | 76 days | 86 | +7.4% |
| Sydney | Frankfurt | Europe | 1 | 2,120 | 1,410 | 3,360 | 81 days | 87 | +8.0% |
| Sydney | Tokyo | Asia | 0–1 | 1,040 | 620 | 1,780 | 52 days | 97 | +4.6% |
| Melbourne | Tokyo | Asia | 0–1 | 1,090 | 650 | 1,850 | 55 days | 93 | +5.2% |
| Sydney | Singapore | Asia | 0 | 890 | 520 | 1,460 | 46 days | 96 | +3.9% |
| Melbourne | Singapore | Asia | 0 | 920 | 550 | 1,520 | 49 days | 92 | +4.1% |
| Sydney | Bangkok | Asia | 0–1 | 860 | 510 | 1,430 | 43 days | 90 | +3.7% |
| Melbourne | Bali/Denpasar | Asia | 0 | 690 | 390 | 1,180 | 38 days | 98 | +2.9% |
These sample values illustrate how analysts can compare markets using multiple dimensions instead of relying on average fare alone. A route with a low average price may still experience substantial volatility, while a more expensive route may demonstrate predictable seasonal patterns.
European Route Dynamics
Historical Flight Price Dataset Australia can reveal how European fares respond to seasonality, airline capacity, connecting hubs, and booking behavior. European demand is generally influenced by Australian summer holidays, European summer travel, Christmas and New Year periods, major sporting events, conferences, and school holiday calendars.
A historical route dataset should therefore separate departure season from booking season. A passenger purchasing a July ticket in February represents a different pricing observation from someone purchasing the same July ticket three days before departure.
Connecting airports are another important variable. Sydney–London fares routed through Singapore, Doha, Dubai, Abu Dhabi, Kuala Lumpur, or other hubs may compete with nonstop or alternative one-stop services. Comparing these itineraries helps analysts understand whether passengers are paying a premium for convenience, shorter travel time, preferred airlines, or better schedules.
Australia–Europe Historical Airfare Trends Analytics can consequently measure median fares, price dispersion, minimum observed fares, maximum fares, fare acceleration, booking-window elasticity, seasonal indices, and airline-level pricing differences.
Asian Route Dynamics
Scrape Australia Asia International Route Demand to identify how passenger interest interacts with airfare movement across major Asian markets. Australia–Asia travel encompasses leisure, business, visiting-friends-and-relatives, education, and connecting traffic, creating different demand patterns from long-haul European markets.
Japan may experience strong seasonal demand around cherry blossom periods and winter travel, while Bali can experience concentrated leisure demand. Singapore can function simultaneously as a destination and a connecting hub. Thailand and Vietnam can display strong leisure-driven demand, whereas China-related markets may be influenced by changing capacity, tourism flows, and bilateral aviation conditions.
A historical collection should therefore capture both price and demand-related signals whenever possible.
Numerical Trend Framework
The second table presents an illustrative multi-year analytical framework. Again, the figures are sample research values rather than official historical international airfare statistics. Actual values should be calculated from collected fare observations.
| Route | 2022 Avg. Fare AUD | 2023 Avg. Fare AUD | 2024 Avg. Fare AUD | 2025 Avg. Fare AUD | 2026 Sample Fare AUD | 2022–26 Change | Peak Month | Lowest Month | Fare Volatility % | Recommended Monitoring |
|---|---|---|---|---|---|---|---|---|---|---|
| Sydney–London | 1,690 | 1,920 | 2,020 | 2,110 | 2,180 | +29.0% | Dec | Feb | 24.8% | Daily |
| Melbourne–London | 1,640 | 1,860 | 1,960 | 2,030 | 2,090 | +27.4% | Dec | Feb | 23.5% | Daily |
| Perth–London | 1,410 | 1,560 | 1,640 | 1,700 | 1,760 | +24.8% | Jul | Feb | 21.9% | Daily |
| Sydney–Paris | 1,730 | 1,970 | 2,060 | 2,160 | 2,240 | +29.5% | Jul | Feb | 26.1% | Daily |
| Sydney–Tokyo | 820 | 900 | 960 | 995 | 1,040 | +26.8% | Apr | Jan | 19.7% | 2× Daily |
| Melbourne–Tokyo | 850 | 930 | 990 | 1,030 | 1,090 | +28.2% | Apr | Jan | 20.3% | 2× Daily |
| Sydney–Singapore | 720 | 780 | 820 | 855 | 890 | +23.6% | Dec | Feb | 17.8% | Daily |
| Melbourne–Singapore | 750 | 800 | 850 | 880 | 920 | +22.7% | Dec | Feb | 18.4% | Daily |
| Sydney–Bangkok | 700 | 750 | 790 | 830 | 860 | +22.9% | Dec | May | 20.1% | Daily |
| Melbourne–Bali | 560 | 610 | 640 | 670 | 690 | +23.2% | Dec | Feb | 25.4% | 2× Daily |
The value of this structure is not simply historical reporting. It supports forecasting. Once enough observations have accumulated, models can estimate expected fare ranges based on departure date, booking lead time, route, airline, season, holidays, capacity, and previous price movements.
Connecting Fare Data With Capacity and Demand
Real-Time Flight Data Scraping API can complement historical datasets by providing continuously refreshed observations. Historical data explains what happened, while real-time data shows what is happening now. Combining the two creates a stronger pricing intelligence environment.
BITRE's current international statistics demonstrate why capacity should be included. In March 2026, Australia recorded 18,209 international flights and 4.541 million available seats, compared with 17,068 flights and 4.431 million seats in March 2025. Passenger traffic increased faster than available seats, producing an 83.0% seat utilisation rate in March 2026 compared with 76.7% in March 2025.
This illustrates an important analytical principle: fare movement should not be interpreted independently from capacity and utilization. Rising demand combined with constrained capacity can produce different pricing outcomes from rising demand accompanied by substantial additional seats.
Historical Airfare Trends Monitoring can therefore combine fare observations with seat availability, flight frequency, airline participation, route launches, cancellations, booking lead time, and seasonal demand indicators. This allows analysts to identify abnormal price movements instead of simply recording them.
Applications for Airlines and Travel Businesses

Demand Forecasting is one of the strongest applications of historical airfare intelligence. Models can use previous fare trajectories to estimate whether a route is entering a high-demand period and whether current prices are unusually high or low relative to historical behavior.
Airlines can use such intelligence for competitive benchmarking, fare positioning, route planning, promotional timing, and capacity decisions. OTAs can improve fare comparison, recommendation engines, price alerts, and customer targeting. Corporate travel platforms can identify cost-saving booking windows.
Travel investors and tourism organizations can use the dataset to study route accessibility, destination affordability, market recovery, and competitive changes.
The dataset can also support anomaly detection. If a route normally sells within a defined price band but suddenly experiences a sharp increase, analysts can investigate capacity reductions, special events, schedule changes, competitor exits, or demand shocks.
Data Collection and Quality Considerations
Reliable historical airfare research requires consistent collection methodology. Every observation should retain its timestamp because flight prices are dynamic. Route definitions should also remain consistent so that a nonstop itinerary is not accidentally compared with a two-stop itinerary.
Currency normalization is essential for long-term comparisons. Taxes, baggage, fare class, refundability, and payment conditions should be captured where available. Duplicate itineraries should be removed, while alternative airline combinations should remain distinguishable.
The collection architecture should also preserve raw observations before transformation. This creates an audit trail and makes it possible to reproduce historical calculations.
BITRE provides useful complementary aviation datasets, including international passenger, freight, mail, flight, seat, and load-factor time series, with information available by airline, country, and city pair. Its international monthly publications also provide downloadable spreadsheet data.
Conclusion
Historical international airfare data provides a much deeper understanding of Australia's global aviation market than isolated price checks. By tracking fares across booking windows, seasons, airlines, cabins, connecting hubs, capacity conditions, and destinations, businesses can transform dynamic ticket prices into measurable market intelligence.
Australia's international passenger market is expanding strongly, with BITRE reporting 45.766 million passengers for the year ended March 2026, an 8.7% annual increase. This recovery reinforces the importance of understanding how demand and capacity translate into airfare movement.
For European markets, historical data can reveal long-haul seasonality, hub competition, and fare acceleration. For Asian markets, it can identify shorter booking cycles, leisure-driven demand, airline competition, and destination-specific patterns. When combined with real-time observations, historical datasets become particularly powerful for forecasting and competitive decision-making.
Most importantly, Booking Trend Insights generated from historical airfare records can help businesses understand not only what travelers paid, but when they booked, which routes became expensive, where capacity influenced prices, and how fare behavior changed over time. A well-designed Australia international airfare dataset can therefore become a strategic foundation for pricing intelligence, route analysis, demand forecasting, travel optimization, and aviation market research.
Ready to elevate your travel business with cutting-edge data insights? Scrape Aggregated Flight Fares to identify competitive rates and optimize your revenue strategies efficiently. Discover emerging opportunities with tools to Extract Travel Website Data, leveraging comprehensive data to forecast market shifts and enhance your service offerings. Real-Time Travel App Data Scraping Services helps stay ahead of competitors, gaining instant insights into bookings, promotions, and customer behavior across multiple platforms. Get in touch with Travel Scrape today to explore how our end-to-end data solutions can uncover new revenue streams, enhance your offerings, and strengthen your competitive edge in the travel market.
Unlock the Full Report
Enter your details to access premium pricing intelligence insights