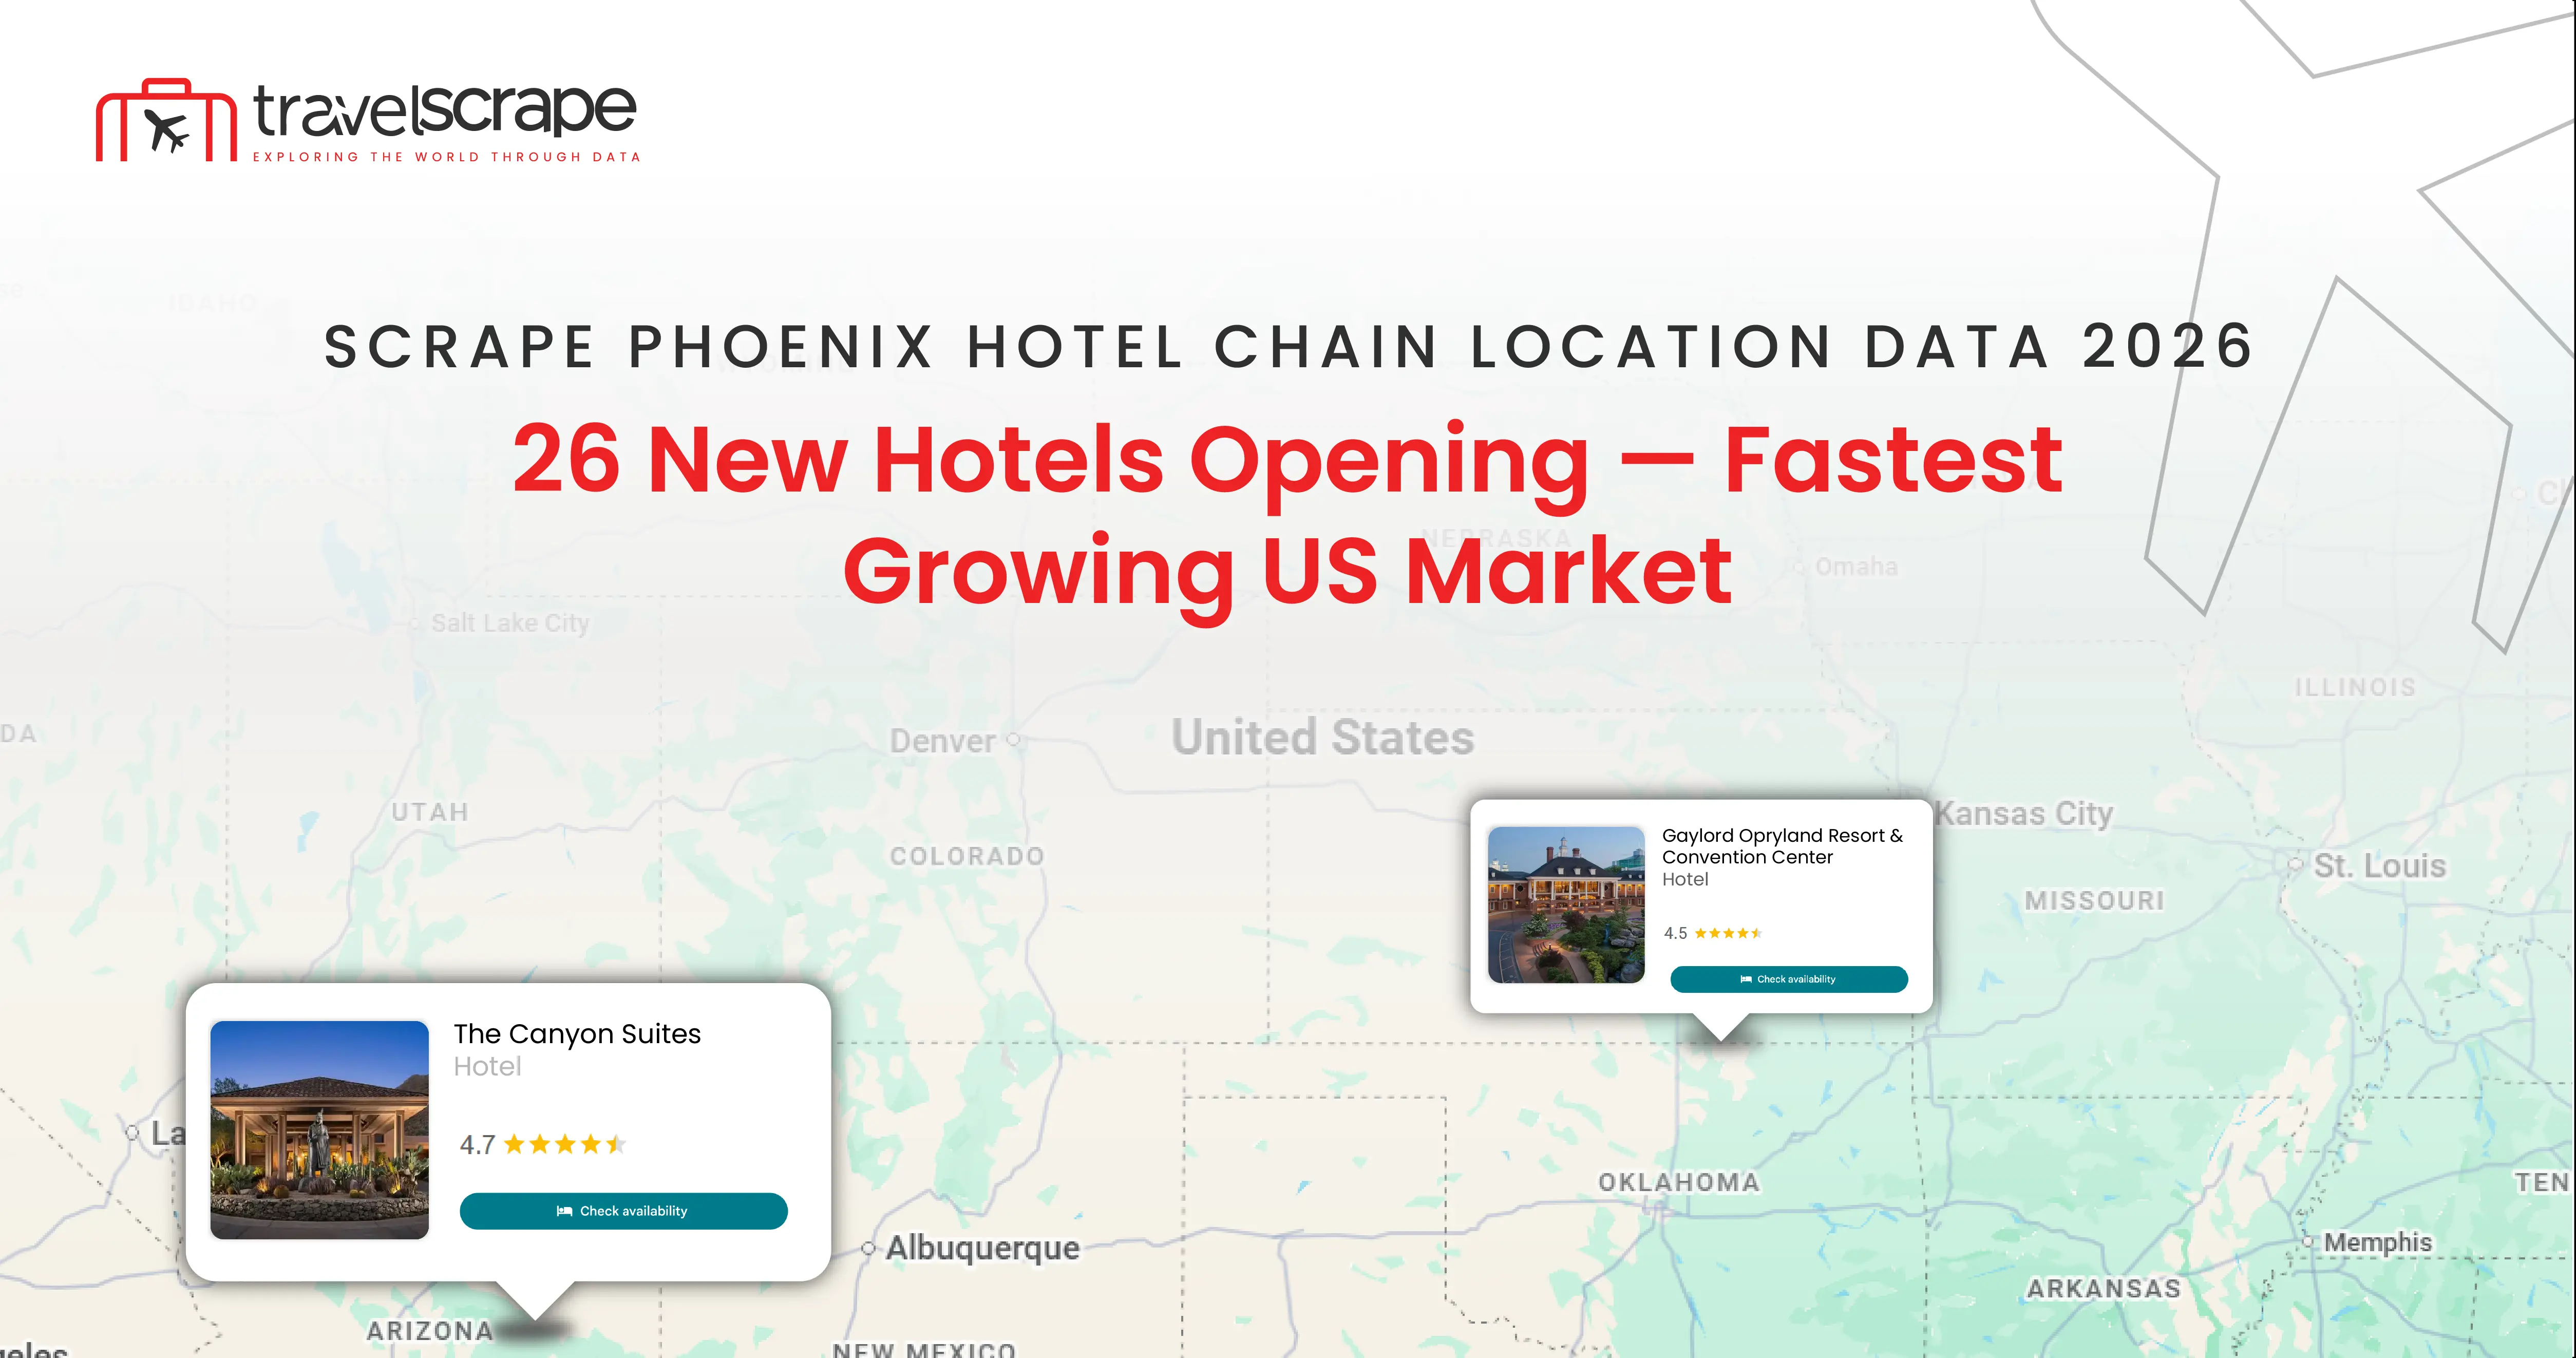
Scrape Phoenix Hotel Chain Location Data 2026: 26 New Hotels Opening — Fastest Growing US Market
Unlock the full potential of Phoenix’s expanding hospitality footprint with data-driven insights on hotel locations, occupancy, pricing, and development trends—turning information into smarter hospitality decisions.
Introduction
The hospitality industry continues to evolve rapidly, making location intelligence essential for understanding hotel supply, competitive positioning, pricing, occupancy, and market expansion. The ability to Scrape Phoenix Hotel Chain Location Data 2026 provides businesses with structured information about hotel properties, brands, locations, room capacity, pricing, guest ratings, and development activity across Phoenix and its surrounding hospitality markets.
Phoenix has developed into one of the most important hotel markets in the Southwest, supported by business travel, tourism, conventions, sporting events, seasonal visitors, and continued population and economic growth. Greater Phoenix includes more than 560 hotels and over 72,000 guest rooms, while Phoenix city itself accounts for more than 170 hotel and resort properties and over 25,000 visitor rooms.
By using Phoenix Hotel chain Location Data Extraction US, hospitality businesses can identify hotel clusters, competitive supply, high-demand areas, emerging submarkets, and opportunities for new property development. Hotel location intelligence can also connect property-level information with pricing, occupancy, reviews, and room availability to create a comprehensive view of Phoenix’s hospitality ecosystem.
Phoenix is also experiencing substantial hotel development activity. Industry pipeline reports indicate thousands of new rooms are expected across the metropolitan area, making hotel supply monitoring increasingly important for investors, hotel operators, tourism companies, and real estate organizations.
171+
Hotels
25,749+
Hotel Rooms
72,000+
Greater Phoenix
Rooms
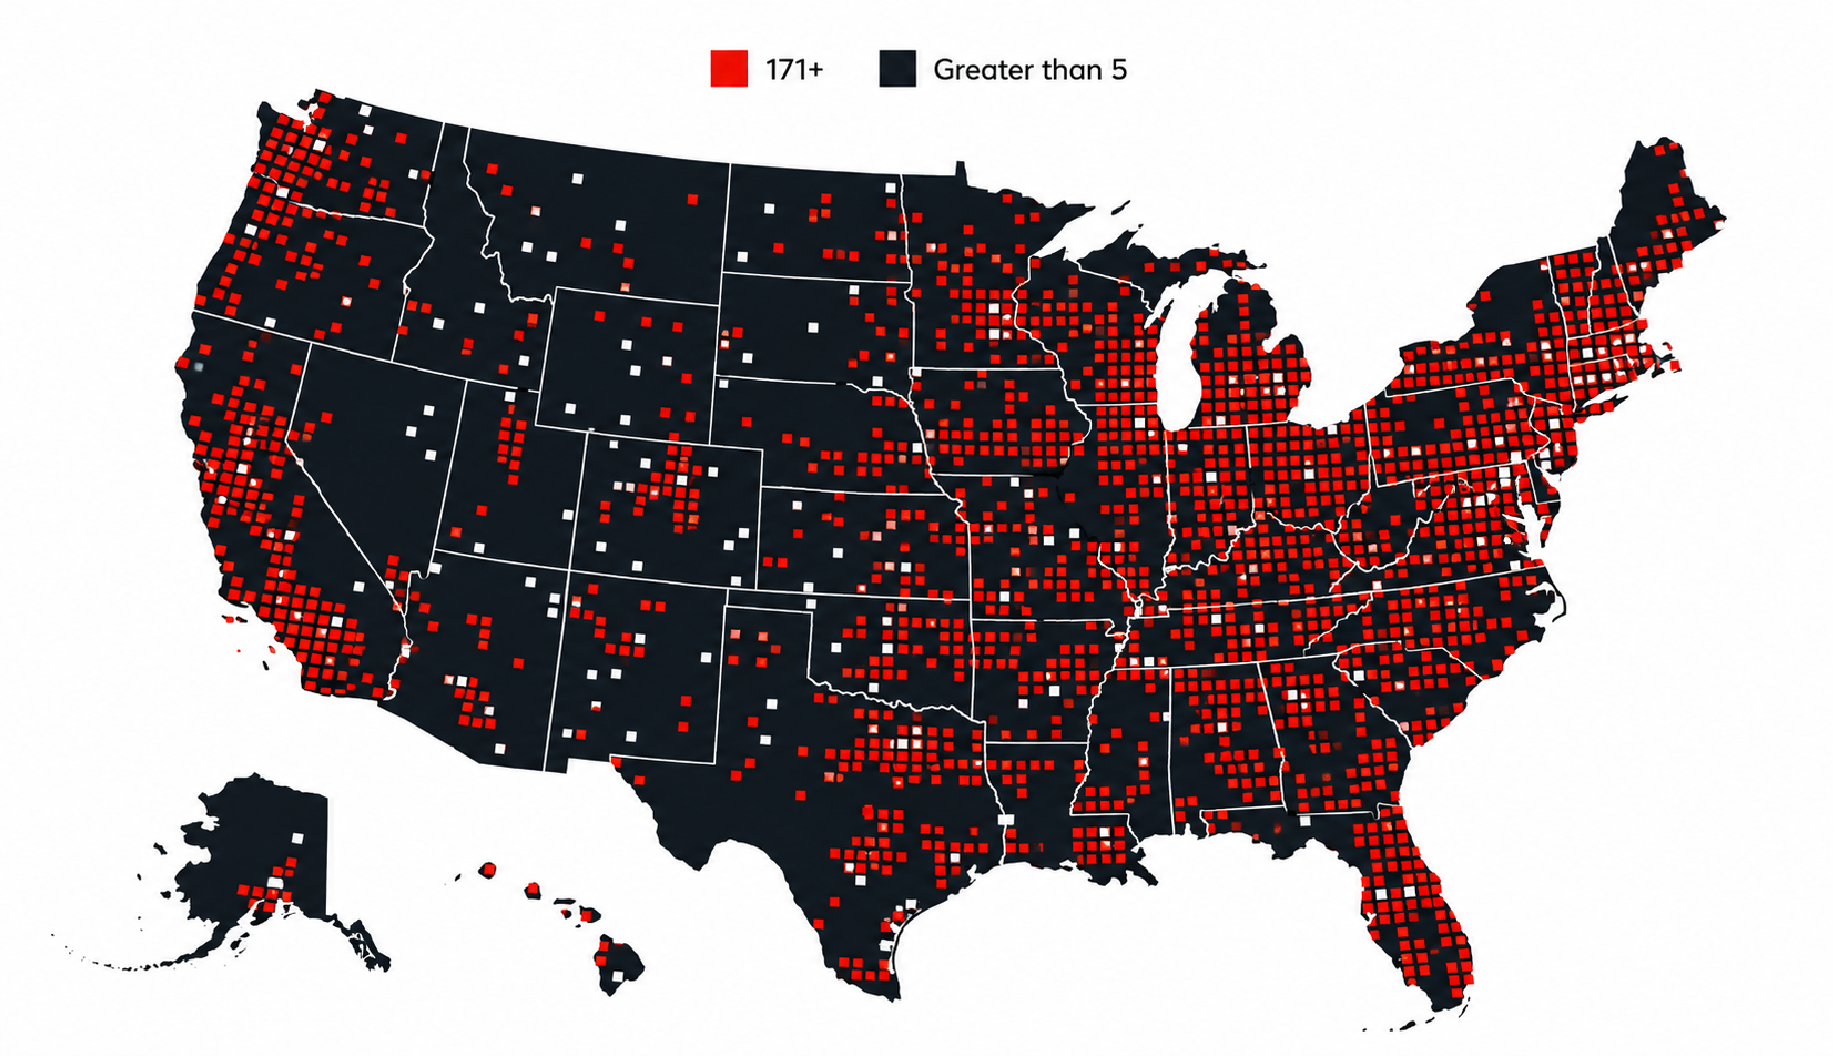
Top Areas by Number of Hotels
Areas with the most hotel properties in the Phoenix metropolitan market.
PHOENIX
171+
SCOTTSDALE
70+
MESA
55+
TEMPE
40+
GLENDALE
35+
CHANDLER
30+
City Level Granularity
Total Cities Covered: 12+ major cities (Phoenix, Scottsdale, Mesa, Tempe, Glendale, Chandler, Gilbert, Peoria, Surprise, Goodyear, Avondale, Buckeye)
High Occupancy Hubs :
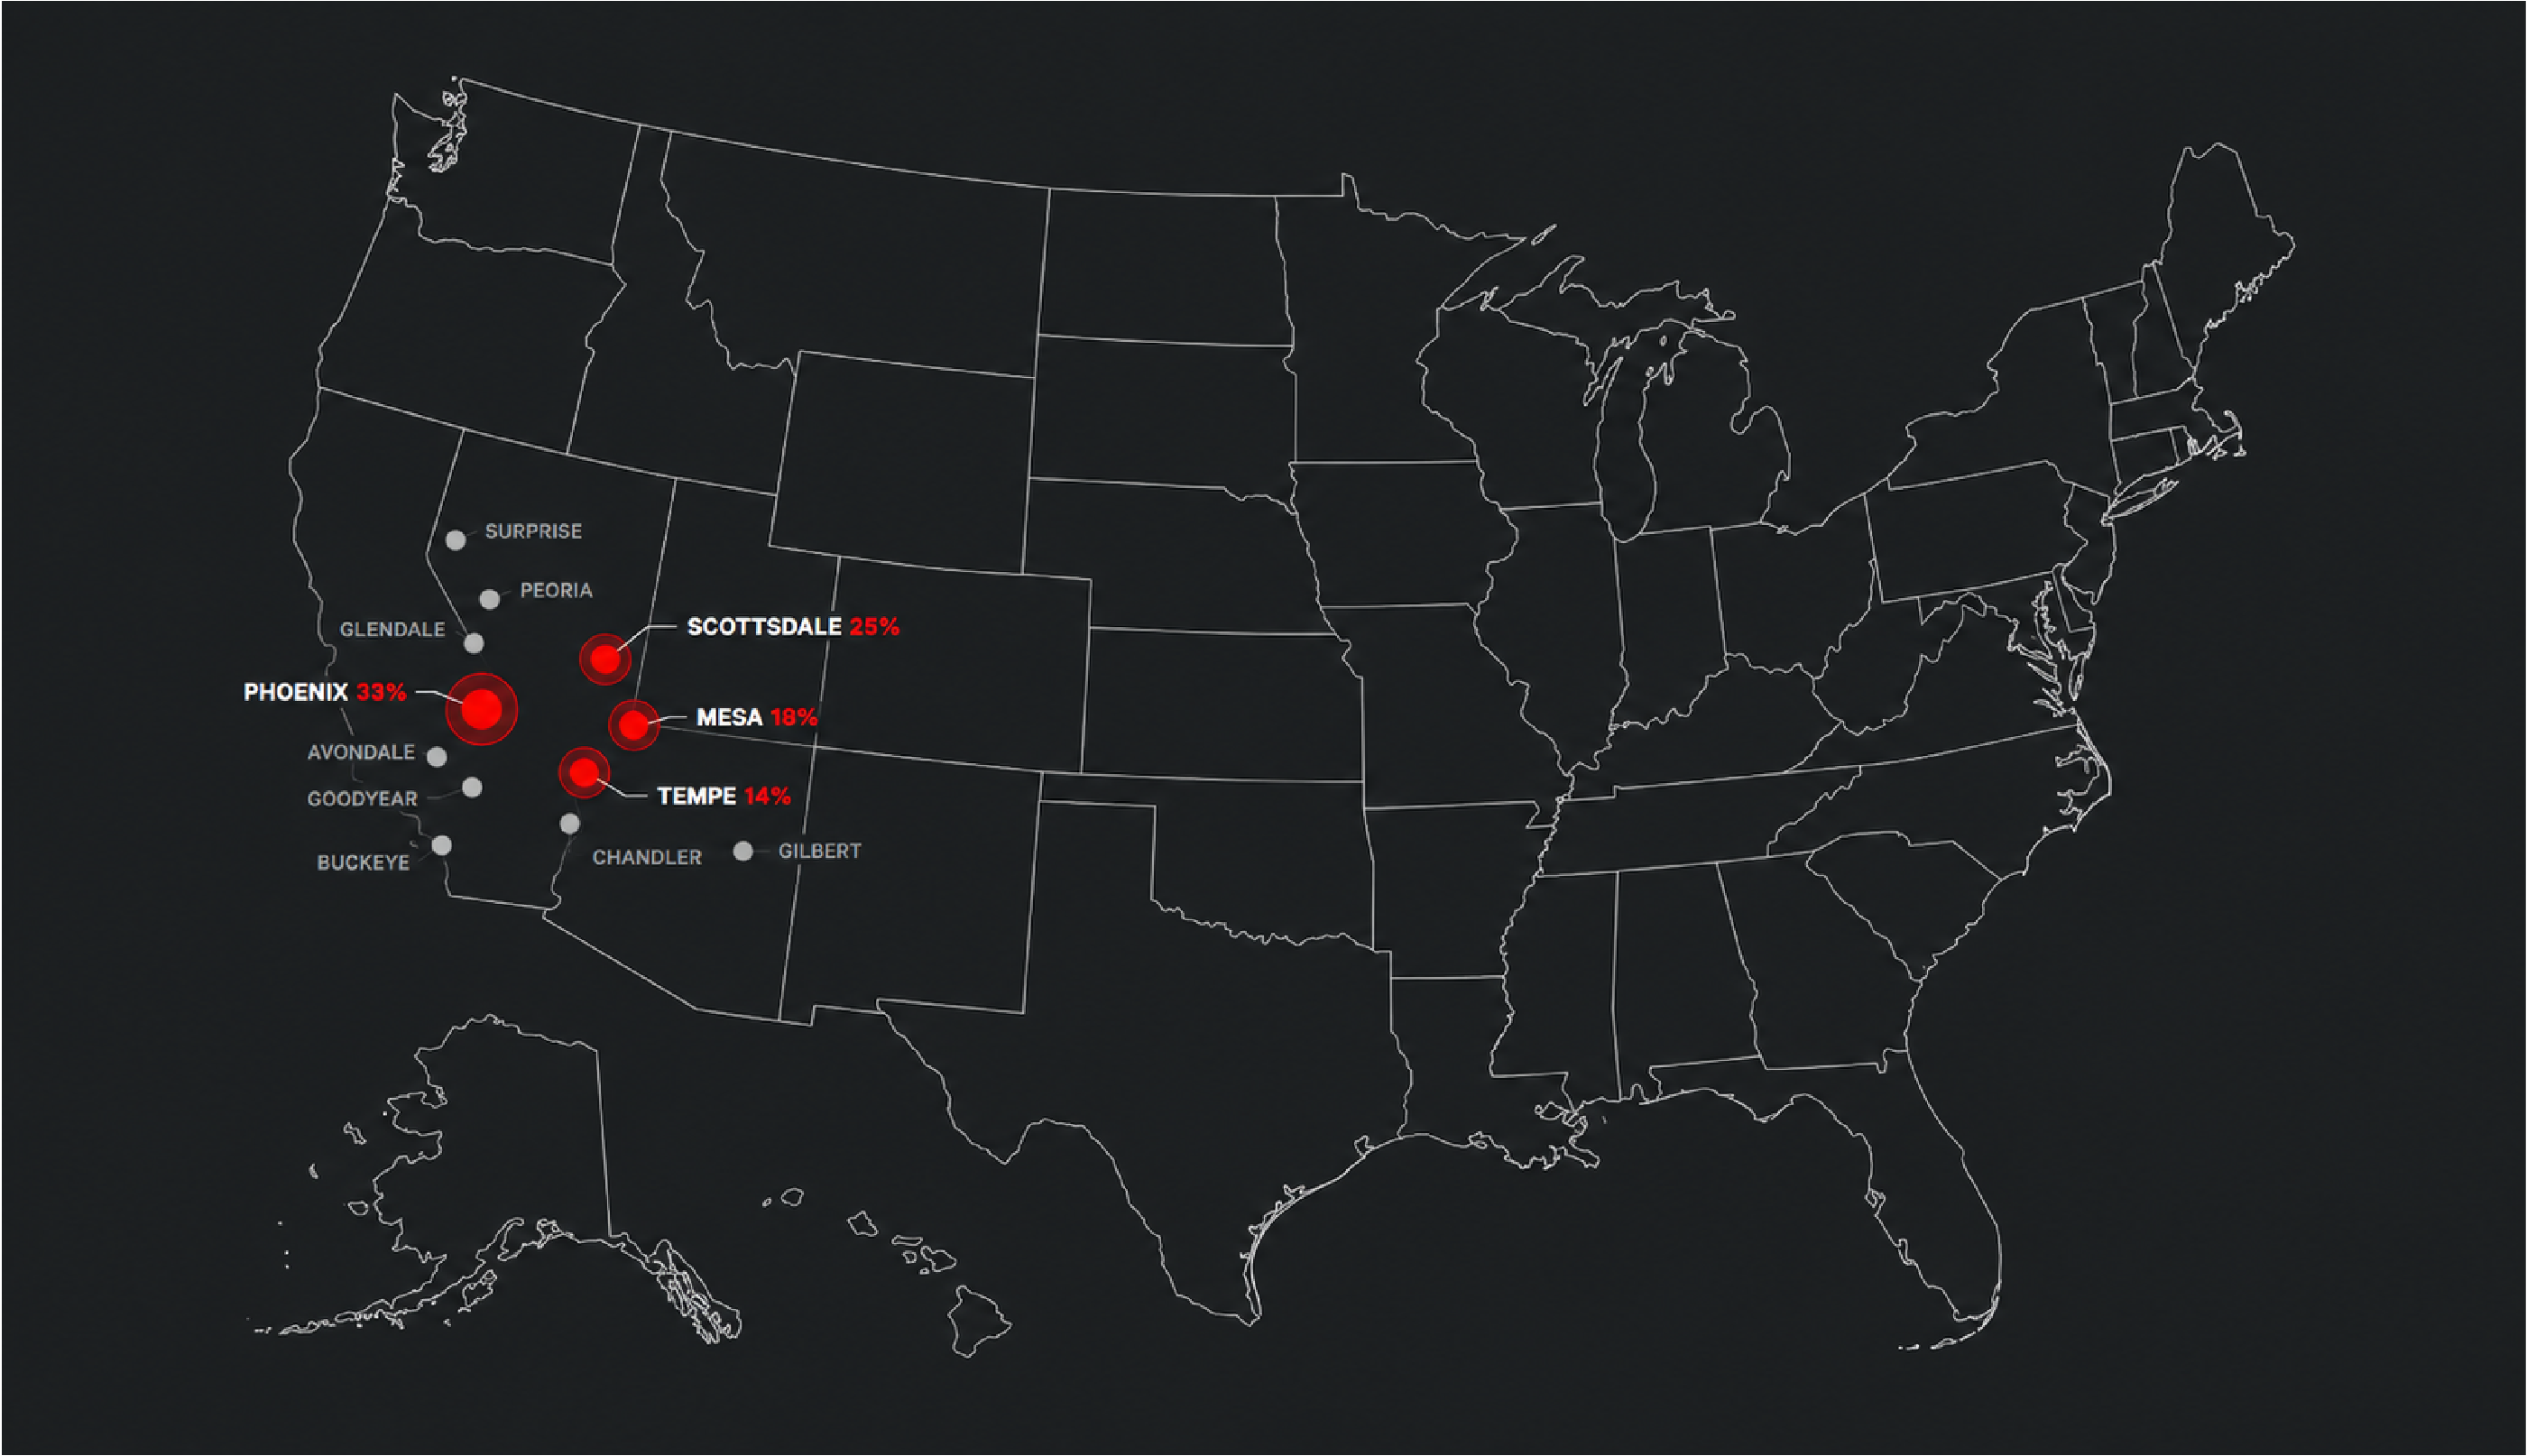
Top Areas with Most Phoenix Hotels in the USA
Based on available market data, the areas with the highest concentration of hotel properties include:
| Rank | State/Area Name | Total Hotels | Key Cities / Submarkets |
|---|---|---|---|
| 01 | Phoenix | 171+ | Downtown Phoenix, North Phoenix, Airport, Camelback |
| 02 | Scottsdale | 70+ | Old Town, North Scottsdale, McCormick Ranch |
| 03 | Mesa | 55+ | Downtown Mesa, East Mesa, Gateway |
| 04 | Tempe | 40+ | ASU, Mill Avenue, Airport Corridor |
| 05 | Glendale | 35+ | Westgate, North Glendale, Sports District |
| 06 | Chandler | 30+ | Downtown Chandler, Price Corridor, Ocotillo |
These areas represent important components of Phoenix’s hospitality market. Phoenix provides the largest overall hotel supply, while Scottsdale has a strong concentration of upscale and resort properties. Mesa, Tempe, Glendale, and Chandler contribute business, leisure, extended-stay, and event-oriented accommodation.
This structured location information is valuable for US Phoenix New Hotel Opening Data forecasting, allowing businesses to monitor upcoming hotel projects, expected room additions, competitive supply changes, and new market opportunities.
Phoenix Hotels in Key US Cities
| Rank | City Name | Hotels | Avg Review | Star Rating | Starting Price |
|---|---|---|---|---|---|
| 01 | Phoenix | 171+ | 8.1 | 3★–5★ | $145 |
| 02 | Scottsdale | 70+ | 8.5 | 3★–5★ | $185 |
| 03 | Mesa | 55+ | 8.0 | 2★–4★ | $125 |
| 04 | Tempe | 40+ | 8.2 | 3★–4★ | $140 |
| 05 | Glendale | 35+ | 8.1 | 3★–5★ | $135 |
This table highlights hotel density, guest satisfaction, star classifications, and indicative starting prices across Phoenix’s major hospitality markets. Scottsdale demonstrates stronger luxury and resort positioning, while Phoenix, Mesa, Tempe, and Glendale contain a broader mix of business and leisure properties.
Businesses using US Phoenix Hotel chain Market Intelligence can compare hotel concentrations, guest ratings, price positioning, room supply, and competitive intensity across individual Phoenix submarkets.
Phoenix Hotels with High Occupancy Rates
| Rank | Hotel Name | City | Star Rating | Review Score | Total Rooms | Occupancy Rate (%) |
|---|---|---|---|---|---|---|
| 01 | Sheraton Phoenix Downtown | Phoenix | 4★ | 8.3 | 1,003 | 91% |
| 02 | JW Marriott Phoenix Desert Ridge Resort & Spa | Phoenix | 5★ | 9.0 | 950 | 89% |
| 03 | Westin Kierland Resort & Spa | Scottsdale | 5★ | 8.8 | 735 | 88% |
| 04 | Arizona Biltmore | Phoenix | 5★ | 8.7 | 703 | 87% |
| 05 | Arizona Grand Resort & Spa | Phoenix | 4★ | 8.2 | 744 | 86% |
Hotels with high occupancy potential provide valuable insights into Phoenix’s competitive hospitality environment. Occupancy figures in this table are analytical benchmark estimates designed for market modeling rather than official property-reported occupancy figures.
Property-level occupancy intelligence can help operators evaluate demand patterns, optimize room rates, identify high-performing locations, and benchmark competing hotel chains.
Businesses can Extract Phoenix US Hotel Chain Location Supply Data to analyze property concentration, room inventory, chain presence, and accommodation supply across high-demand Phoenix locations.
Distribution of Phoenix Hotels Across Major US Cities
| Rank | City | Number of Hotels | Total Rooms | Avg Review Score | Starting Price (USD) |
|---|---|---|---|---|---|
| 01 | Phoenix | 171+ | 25,749+ | 8.1 | 145 |
| 02 | Scottsdale | 70+ | 10,500+ | 8.5 | 185 |
| 03 | Mesa | 55+ | 6,500+ | 8.0 | 125 |
| 04 | Tempe | 40+ | 4,800+ | 8.2 | 140 |
| 05 | Glendale | 35+ | 4,200+ | 8.1 | 135 |
| 06 | Chandler | 30+ | 3,600+ | 8.0 | 130 |
This table provides a clear view of Phoenix’s hotel distribution across major cities and submarkets. Phoenix has the largest overall room supply, while Scottsdale commands higher average pricing because of its luxury, resort, and leisure-oriented inventory.
This information is useful for organizations building US Phoenix Hotel Chain Location Pipeline Data API solutions to continuously monitor existing properties, planned hotels, construction projects, expected openings, and new room supply.
Phoenix’s hotel pipeline remains significant, with industry reports identifying more than 100 projects and more than 16,000 rooms in various stages of development entering 2026. The market therefore provides substantial opportunities for businesses monitoring future accommodation supply.
Looking to Give Your Hotel Business an Edge?
“Collect comprehensive Phoenix hotel location data to drive smarter decisions, optimize operations, monitor competitive supply, and uncover growth opportunities across the U.S. hospitality market.”
Advantages of Phoenix Hotel Location Data Over Generic Hotel Datasets
Phoenix-specific hotel datasets provide precise and actionable information that helps hospitality organizations understand competitive supply, market expansion, and property-level performance.
- Hospitality Consulting Firms: Enables Hotel Chains Data Scraping to analyze hotel supply, pricing trends, occupancy patterns, development pipelines, and guest feedback to support strategic consulting.
- Real Estate & Site Selection Teams: Uses Hotel Data Intelligence to identify high-demand urban, airport, resort, suburban, and employment-oriented locations for property acquisition and expansion.
- Hotel Investors & REITs: Leverages the Hotel Room Price Trends Dataset to evaluate granular property information, room supply, pricing indicators, occupancy benchmarks, and development data for investment decisions.
- Tourism Boards & Travel Tech Companies: Uses the Hotel Availability Forecast Dataset to support destination planning, competitive benchmarking, accommodation supply monitoring, and market demand analysis.
| Fields Name | Description |
|---|---|
| Hotel Name & Brand | Identifies the specific Phoenix property and its hotel chain or brand. |
| Location Details | Includes city, submarket, full address, ZIP code, and GPS coordinates for mapping and site analysis. |
| Room & Occupancy Data | Total number of rooms, occupancy rates, and booking trends for revenue optimization. |
| Pricing & Rate Information | Average room rates, seasonal pricing, and dynamic pricing trends. |
| Guest Ratings & Reviews | Average review scores, total number of reviews, and guest feedback for service benchmarking. |
| Development Pipeline | Planned properties, construction status, expected openings, and projected room additions. |
Insights and Analysis
Urban & Resort Concentration
Phoenix and Scottsdale represent the strongest hospitality centers within the metropolitan region. Phoenix combines business, convention, airport, and leisure hotels, while Scottsdale has a stronger concentration of luxury resorts and upscale accommodation.
Luxury vs. Mid-Tier Balance
The Phoenix market includes properties ranging from economy and limited-service hotels to upscale and luxury resorts. This broad segmentation allows operators to serve business travelers, families, leisure tourists, convention visitors, and extended-stay guests.
Occupancy and Revenue Optimization
Using Hotel Room Price Trends Dataset, businesses can evaluate room-rate movements across Phoenix properties and compare seasonal pricing, weekend premiums, event-related increases, and competitive rate changes.
Market Intelligence & Competitive Edge
Accessing structured Phoenix property information creates a stronger foundation for competitive benchmarking, location planning, market entry analysis, and identification of underserved hospitality markets.
Customer Feedback Integration
Guest ratings and reviews provide important indicators of customer satisfaction, service quality, amenities, location convenience, and overall hotel performance. Combining these signals with price and availability data supports stronger market positioning.
Conclusion
By leveraging advanced data analytics to Scrape Hotel Chains Location Data, hospitality businesses can obtain detailed insights into Phoenix hotel distribution, room supply, pricing, occupancy, guest feedback, and development pipelines.
Phoenix remains a strategically important hospitality market, with more than 170 hotel and resort properties within the city and more than 25,000 visitor rooms. Greater Phoenix expands this footprint substantially, with more than 560 hotels and over 72,000 guest rooms.
The continued development pipeline makes real-time monitoring increasingly important for investors, hotel operators, travel platforms, tourism organizations, and real estate companies. Tracking announced hotels, construction projects, expected openings, room counts, and locations can reveal where competitive supply is likely to increase.