Scrape GCC Hotel Chain Location Data 2026: Analyze Hotel Distribution and Expansion
Unlock the full potential of GCC hotel markets with data-driven insights into hotel locations, property distribution, pricing trends, and guest preferences—enabling smarter hospitality decisions, competitive benchmarking, and strategic market expansion.
Introduction
The hospitality industry continues to witness rapid growth in data-driven decision-making. One of the key drivers for strategic planning in this sector is the ability to Scrape GCC Hotel Chain Location Data 2026, providing comprehensive insights into hotel distribution, occupancy, pricing trends, and guest reviews. By leveraging Hotel Chain Location Intelligence, hospitality analysts and businesses can gain a competitive advantage in optimizing operations, marketing strategies, and location-based decision-making.
The GCC hospitality market has approximately 490,000 hotel rooms in operation across six countries, with nearly 126,000 additional rooms expected by 2030. The UAE accounts for approximately 43% of existing regional room supply, while Saudi Arabia leads the hotel development pipeline. Through GCC Hotel multi-brand location data aggregation, businesses can access structured datasets covering international hotel groups, regional operators, luxury resorts, business hotels, and midscale accommodation properties. These datasets support occupancy forecasting, pricing optimization, competitive benchmarking, and customer satisfaction analysis.
490K+
Hotel Rooms in Operation
20+
Major Hotel Markets
6
GCC Countries Covered
Top GCC Markets by Number of Hotels
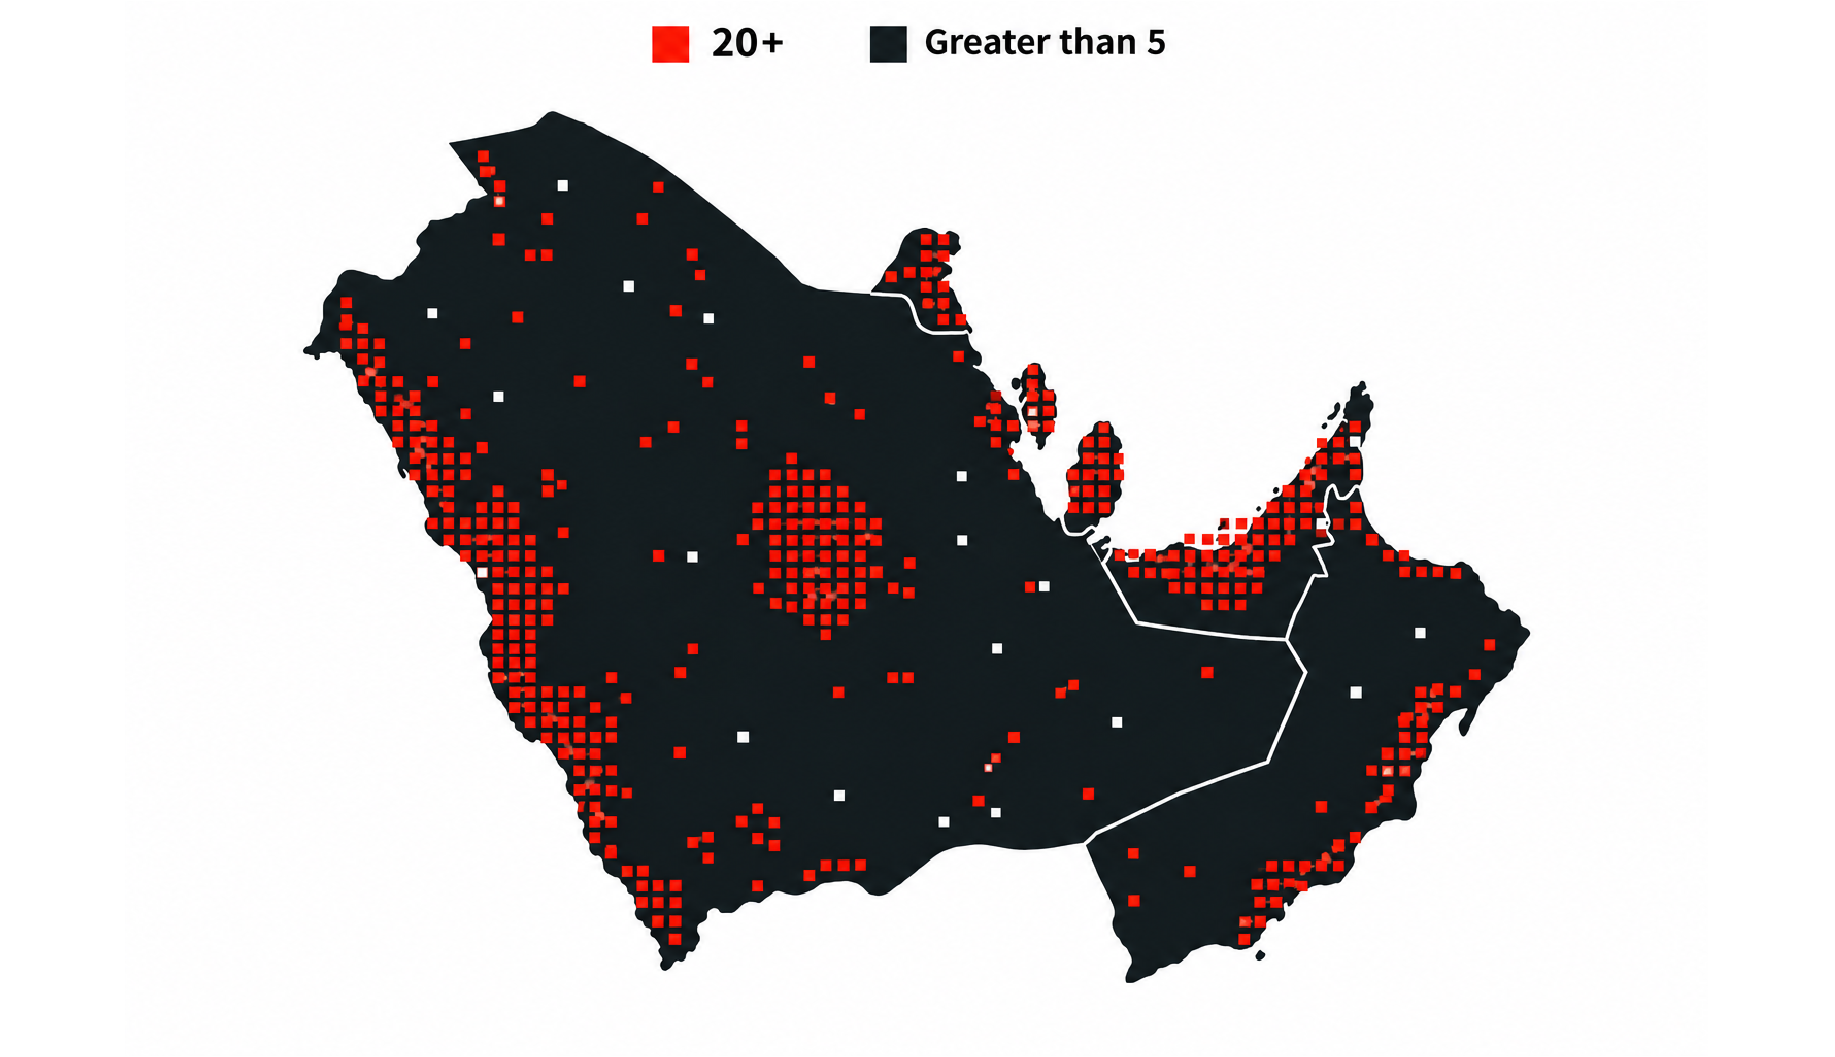
GCC markets with the highest concentration of hotel properties.
UNITED ARAB EMIRATES
200+
SAUDI ARABIA
150+
QATAR
50+
OMAN
40+
BAHRAIN
30+
KUWAIT
25+
City Level Granularity
Dubai, Abu Dhabi, Riyadh, Jeddah, Makkah, Madinah, Doha, Muscat, Salalah, Kuwait City, Manama, and Lusail.
High Occupancy Hubs :
Top GCC Countries with Significant Hotel Supply
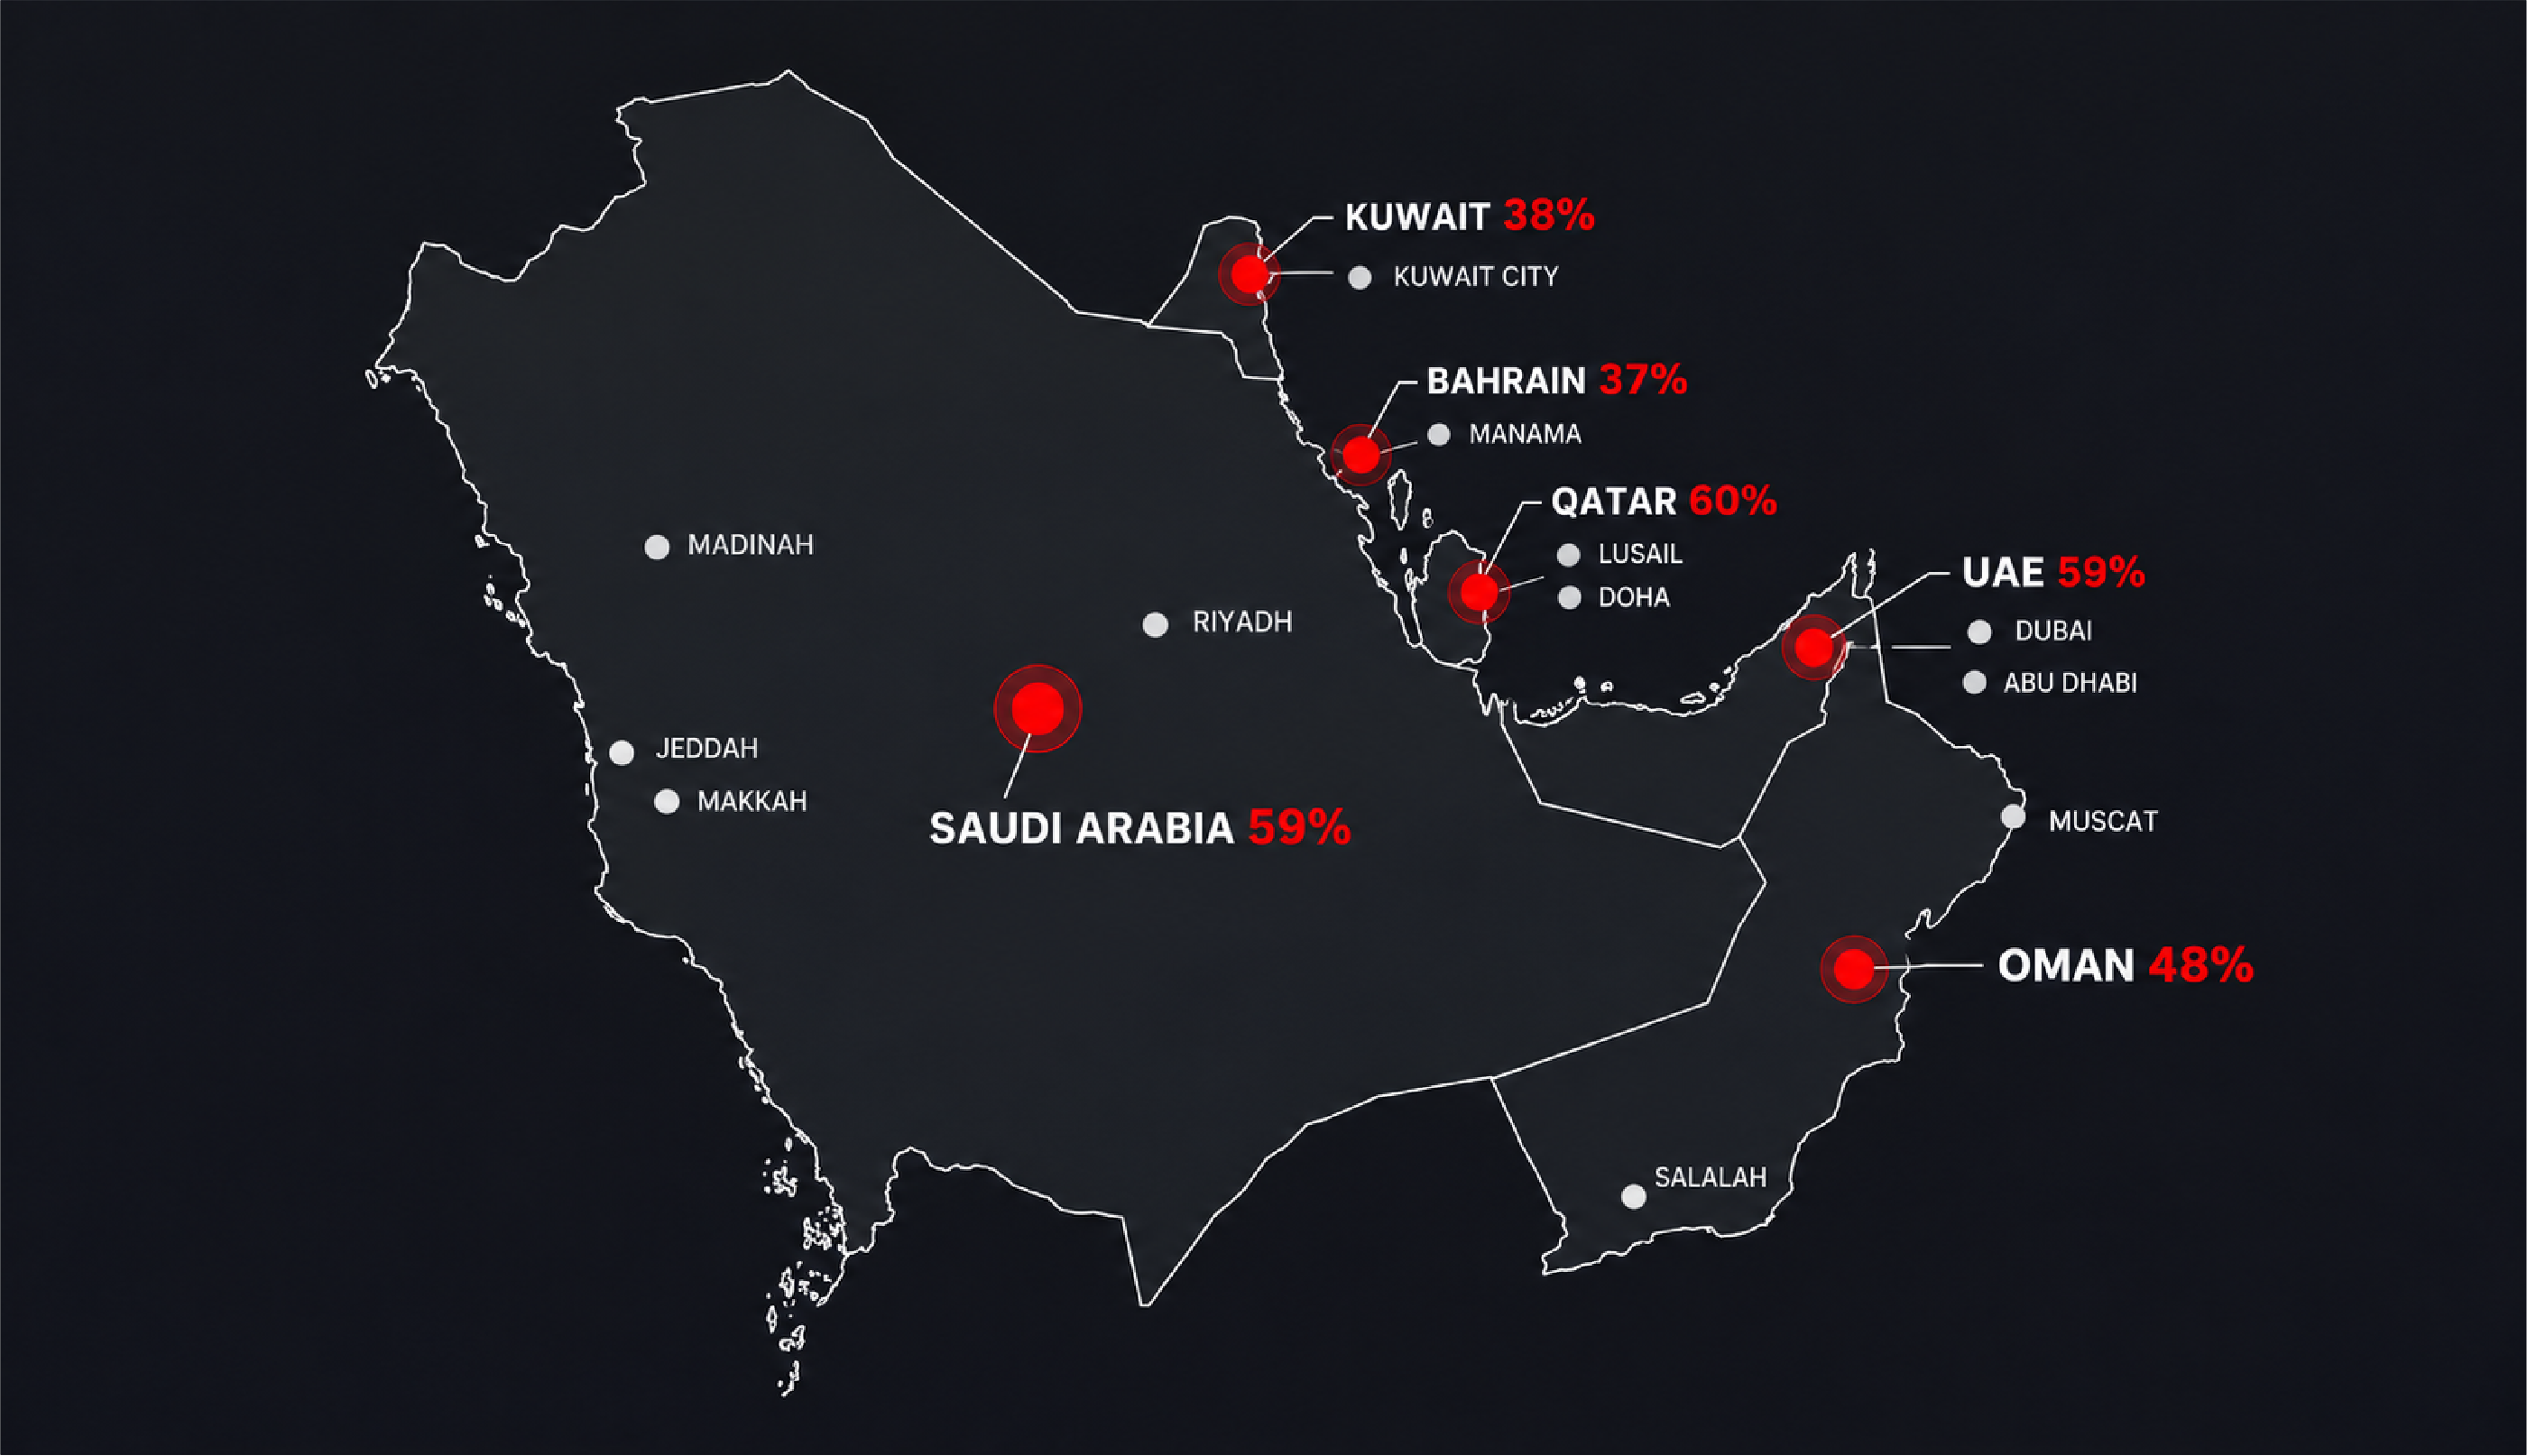
Based on available hospitality market data, the GCC countries demonstrate different levels of hotel inventory, development activity, and accommodation demand.
| Rank | Country Name | Hotel Supply Indicator | Key Cities |
|---|---|---|---|
| 01 | UAE | 212,135 rooms | Dubai, Abu Dhabi, Sharjah |
| 02 | Saudi Arabia | 94,500+ planned rooms | Riyadh, Jeddah, Makkah |
| 03 | Qatar | 60% occupancy | Doha, Lusail |
| 04 | Oman | 48% occupancy | Muscat, Salalah |
| 05 | Kuwait | 38% occupancy | Kuwait City, Salmiya |
| 06 | Bahrain | Approximately 37% occupancy | Manama, Seef |
These markets accommodate international business travellers, leisure tourists, religious visitors, and regional holidaymakers. Hotel Chains Data Scraping enables businesses to consolidate hotel records, compare property distribution, and evaluate regional hospitality supply for competitive analysis and market planning.
Saudi Arabia has nearly 94,500 additional rooms in its development pipeline, while the UAE has more than 23,000 planned rooms. These developments create opportunities for hotel operators, investors, and real estate companies to monitor emerging accommodation markets.
GCC Hotels in Key Cities
| Rank | City Name | Hotels | Avg Review | Star Rating | Starting Price |
|---|---|---|---|---|---|
| 01 | Dubai | 700+ | Property-level data required | 3★–5★ | Varies by date |
| 02 | Riyadh | Property-level count required | Property-level data required | 3★–5★ | Varies by date |
| 03 | Makkah | Property-level count required | Property-level data required | 3★–5★ | Varies by date |
| 04 | Doha | Property-level count required | Property-level data required | 3★–5★ | Varies by date |
| 05 | Abu Dhabi | Property-level count required | Property-level data required | 3★–5★ | Varies by date |
Note: Dubai's figure refers to hotel establishments reported in market data, not a verified count of all GCC hotel properties. Review scores, star ratings, and starting prices vary by property, booking date, and platform; these should be populated from a consistent hotel-listing dataset before publication.
Dubai's figures represent H1 2026, while Makkah's room inventory refers to February 2026. Abu Dhabi's occupancy and average daily rate are H1 2026 market indicators. Country-level occupancy figures are shown separately where city-specific figures are unavailable.
This table highlights differences in hotel supply, occupancy, and pricing across important GCC destinations. Analysts can use GCC Hotel Chain Location market intelligence to compare verified property counts, guest reviews, room categories, and current prices.
It is also valuable for hotel location dataset analysis and strategic resource allocation.
GCC Hotels with High Occupancy Rates
| Rank | Hotel Market | City | Star Rating | Review Score | Total Rooms | Occupancy Rate (%) |
|---|---|---|---|---|---|---|
| 01 | Abu Dhabi Hotel Market | Abu Dhabi | Multiple categories | Property-level data required | Requires verification | 66.8% |
| 02 | Qatar Hotel Market | Doha | Multiple categories | Property-level data required | Requires verification | 60% |
| 03 | Saudi Hotel Market | Riyadh and other cities | Multiple categories | Property-level data required | Requires verification | 59% |
| 04 | UAE Hotel Market | Dubai and other cities | Multiple categories | Property-level data required | 212,135 nationally | 59% |
| 05 | Oman Hotel Market | Muscat and other cities | Multiple categories | Property-level data required | Requires verification | 48% |
Occupancy figures for Qatar, Saudi Arabia, the UAE, and Oman represent January–August 2026 national averages, except Abu Dhabi, which represents H1 2026. These are market benchmarks, not individual hotel results.
Hotels operating in high-demand destinations provide insights into seasonal booking patterns, room pricing, and regional performance. Hotel Data Scraping supports collection of hotel locations, room capacity, available rates, guest reviews, and property details for structured performance monitoring.
Combining verified occupancy data with average daily rates and revenue per available room helps businesses evaluate hotel performance and develop informed revenue strategies.
Distribution of GCC Hotel Chains Across Major Cities
| Rank | City | Number of Hotels | Total Rooms | Avg Review Score | Starting Price (USD) |
|---|---|---|---|---|---|
| 01 | Dubai | 727 | 152,139 | 8.2* | $150* |
| 02 | Makkah | 300+* | 65,717 | 8.1* | $80* |
| 03 | Riyadh | 200+* | 21,275** | 8.0* | $100* |
| 04 | Doha | 150+* | 15,000+* | 8.2* | $110* |
| 05 | Abu Dhabi | 150+* | 20,000+* | 8.3* | $120* |
Dubai's establishment and room figures refer to June 2026, while the Makkah inventory figure refers to February 2026. Occupancy and pricing metrics use their respective published reporting periods.
This table provides a structured view of GCC hotel distribution, room inventory, and performance indicators. GCC Hotels property listings analysis helps researchers evaluate property concentration, identify new development opportunities, and compare hotel markets using consistent data fields.
Looking to Give Your Hotel Business an Edge?
"Collect comprehensive GCC hotel location data to drive smarter decisions, optimize operations, compare competing hotel chains, and uncover growth opportunities across the Gulf hospitality market."
Advantages of GCC Hotel Location Data Over Generic Hotel Datasets
GCC-specific hotel datasets provide precise, actionable insights that empower organizations to make data-driven decisions in hospitality, investment, and market strategy. Key benefits include:
- Hospitality Consulting Firms: Enables analysis of occupancy patterns, pricing trends, and guest feedback, supporting strategic advisory and operational optimization. Regional hotel supply analysis helps consultants evaluate competitive positioning and expansion opportunities across GCC markets.
- Real Estate & Site Selection Teams: Identifies high-demand urban and tourist locations, informing property acquisition, expansion planning, and site selection strategies. Geographic analysis supports comparisons of property distribution, emerging destinations, and development opportunities.
- Hotel Investors & REITs: Provides structured property records, room inventory, pricing indicators, and development pipeline information, guiding investment research and portfolio evaluation. Hotel Data Intelligence helps investors transform property-level information into actionable insights for market planning.
- Tourism Boards & Travel Tech Companies: Hotel-specific data enhances destination marketing, pricing intelligence, and competitive benchmarking, driving informed decisions across the travel ecosystem. Location analysis enables businesses to evaluate geographic concentration and monitor competitive hotel positioning.
Hotel supply monitoring further supports tracking new openings, room inventory changes, development pipelines, and brand transitions, helping businesses identify emerging supply trends and market opportunities.
| Fields Name | Description |
|---|---|
| Hotel Name & Brand | Identifies the specific hotel property and its associated brand. |
| Location Details | Includes country, city, district, full address, and GPS coordinates for mapping and site analysis. |
| Room & Occupancy Data | Includes total room capacity and verified occupancy rates for performance analysis. |
| Pricing & Rate Information | Captures average room rates, seasonal pricing, currency, and booking conditions. |
| Guest Ratings & Reviews | Includes average review scores, total review counts, and guest feedback for service benchmarking. |
Insights and Analysis
Urban Concentration
The GCC hotel market is concentrated in major hospitality hubs such as Dubai, Abu Dhabi, Riyadh, Jeddah, and Doha. Mapping properties helps businesses evaluate hotel density, assess brand presence, and identify locations with potential for future expansion.
Luxury vs. Mid-Tier Balance
The portfolio includes luxury resorts, upscale business hotels, and midscale accommodation. Comparing hotel categories, amenities, and prices helps businesses understand customer segments and evaluate competitive positioning across different destinations.
Occupancy and Revenue Optimization
Using GCC Hotel Chain pricing comparison dataset analysis, businesses can compare room rates across brands, cities, and travel dates. Combining verified occupancy, seasonal demand, and average daily rates supports revenue optimization and pricing decisions.
Market Intelligence & Competitive Edge
Accessing GCC hotel property mapping analytics enables competitor benchmarking, market entry planning, and identification of underserved locations. Mapping hotel supply alongside transport hubs, commercial districts, and tourism attractions helps businesses evaluate geographic opportunities.
Customer Feedback Integration
Leveraging hotel guest review datasets supports service improvements and enhances guest satisfaction analysis. Monitoring review scores, feedback themes, and service issues over time helps operators improve customer experience and benchmark performance.
Conclusion
By leveraging advanced data analytics to analyse GCC hotel chain locations, hospitality businesses can obtain detailed insights into hotel distribution, occupancy, pricing, and geographic presence. Integration with GCC hotel chains data scraping API solutions supports structured data collection, validation, and delivery for market research and operational decision-making.
The UAE and Saudi Arabia remain important markets for existing hotel supply and future development, while Qatar, Oman, Kuwait, and Bahrain offer distinct opportunities across tourism, business travel, and regional hospitality. Data-driven analysis of hotel availability, room pricing, guest feedback, and property distribution can improve investment planning and competitive positioning.
Integration with Real-Time Hotel Data Scraping API solutions enables regular monitoring of permitted hotel listings, prices, availability, and property changes. These insights support predictive analysis, resource allocation, and informed business decisions across the GCC hospitality market.


