Hotel Rate Benchmarks for Corporate Travel-Policy Validation: A Corporate Hotel Rate Scraping Case Study
At a glance
| Item | Detail |
|---|---|
| Client | Multinational company headquartered in India with frequent domestic and international business travel |
| Market | 40 business cities in India, the Middle East, Southeast Asia, Europe and the US |
| Sources | Major online travel agencies and hotel brand websites |
| Scope | Live rates for business-grade hotels near the client's offices and customer sites |
| Frequency | Weekly, with monthly policy reports |
| Delivery | Dashboard and monthly Excel report |
| Service | Corporate hotel rate scraping by Travel Data Scrape |
The Client
The client's travel policy set nightly hotel caps by city. Employees regularly reported that they could not find suitable hotels within the cap, while finance suspected that some caps were too generous. The travel team asked Travel Data Scrape for data "to validate internal policy against current hotel rates." A separate request in the same period, for a Bengaluru hotel-rate dataset over a set date range, showed that the need extends to researchers and analysts too.
Challenges in the Travel Industry
Policy caps were outdated
Most caps had been set two years earlier and not reviewed.
Location matters
A cap that works near the airport may be unrealistic in the central business district.
Day-of-week and season
Business hotels price higher midweek and during trade fairs.
Comparable quality
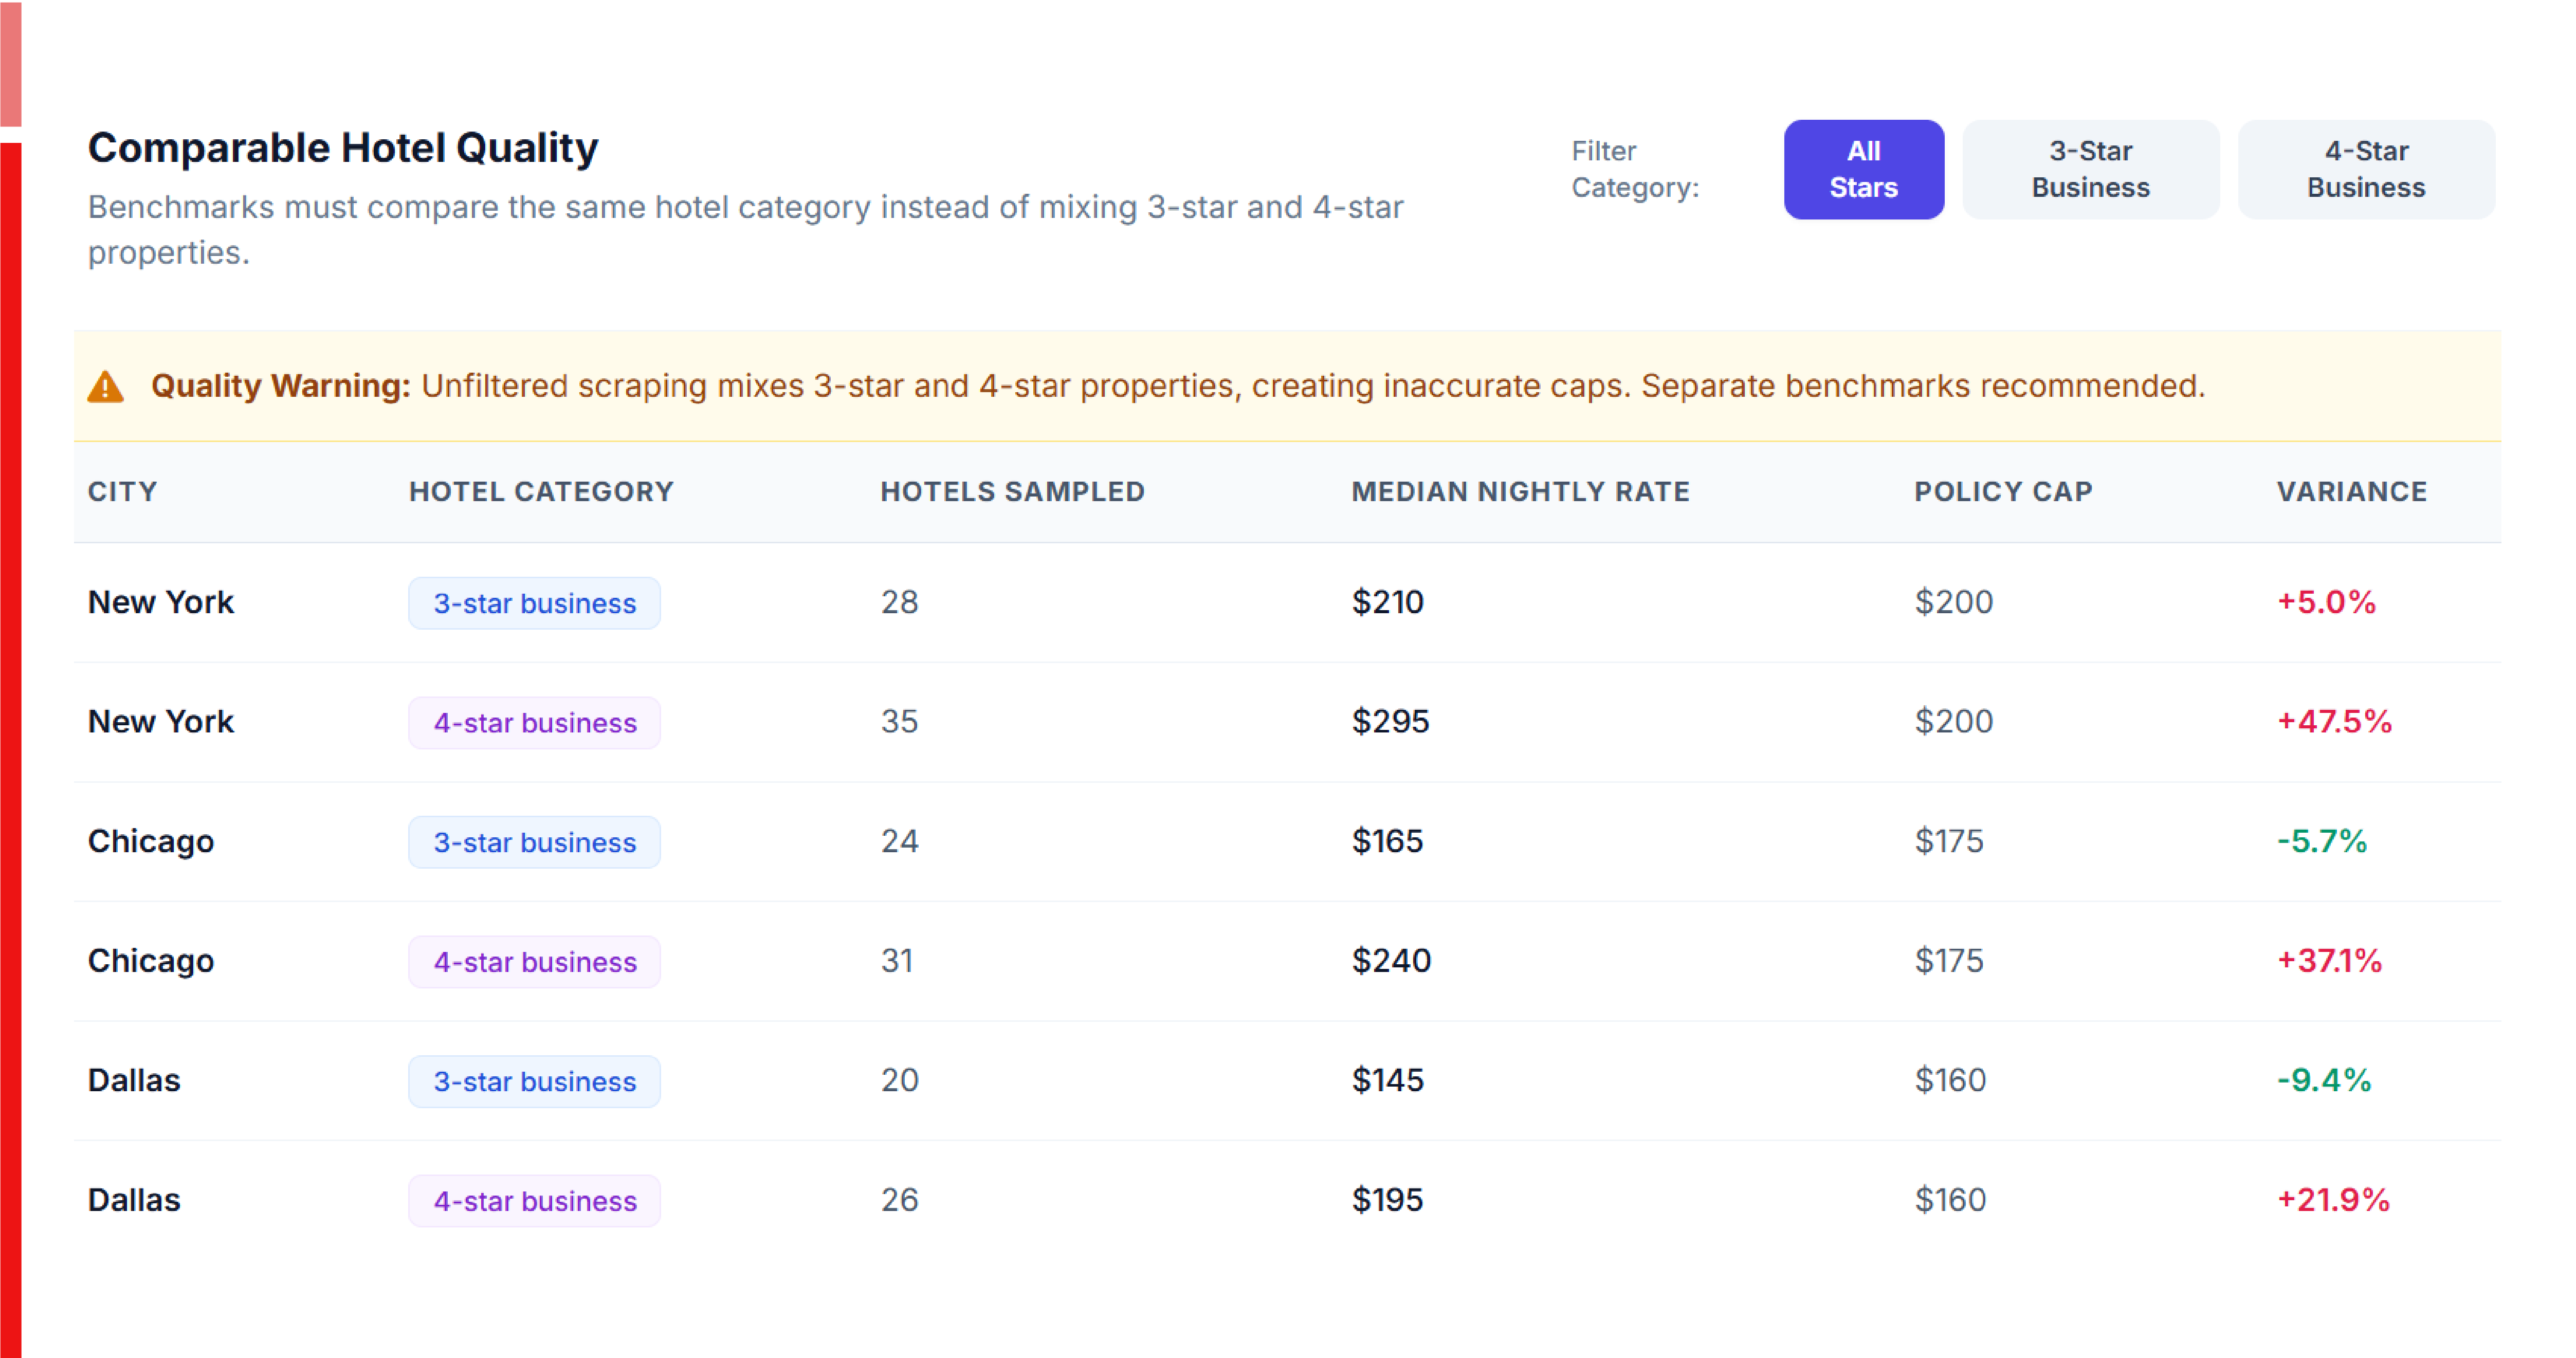
The policy allowed 3-star and 4-star business hotels, so benchmarks had to match.
Our Approach
Step 1: Define the hotel set
For each city, Travel Data Scrape listed business-grade hotels within 5 km of the client's offices and main customer sites, filtered by star rating and guest-rating threshold.
Step 2: Rate collection
Rates were collected weekly for stays 7, 14 and 30 days ahead, for both a Tuesday night and a Saturday night, for one adult in a standard room, with flexible (refundable) rate where available and breakfast flag recorded.
Step 3: Normalisation
Rates were converted to the policy currency, with taxes included or excluded consistently according to the policy definition.
Step 4: Policy comparison
For each city, the median and 75th percentile rates were compared with the policy cap. The share of hotels available within the cap was calculated.
Step 5: Reporting
A monthly report recommended cap changes by city, with supporting data.
Sample data delivered
The record below is illustrative.
{
  "city": "Mumbai",
  "zone": "BKC",
  "hotel_name": "Example Business Hotel",
  "star_rating": 4,
  "guest_rating": 8.4,
  "distance_to_office_km": 1.6,
  "stay_night": "Tuesday",
  "lead_time_days": 14,
  "room_type": "Standard",
  "rate_type": "Flexible",
  "breakfast_included": true,
  "rate_inr_incl_tax": 11800,
  "policy_cap_inr": 9000,
  "within_cap": false,
  "collected_at": "2026-10-06"
}
Results Snapshot
| City (illustrative) | Policy cap | Median weekday rate | 75th percentile | Share of hotels within cap | Recommendation |
|---|---|---|---|---|---|
| Mumbai (BKC) | ₹9,000 | ₹11,200 | ₹13,900 | 18% | Raise cap to ₹11,500 |
| Bengaluru (ORR) | ₹8,000 | ₹7,600 | ₹9,100 | 58% | Keep cap |
| Dubai (Business Bay) | AED 650 | AED 590 | AED 760 | 61% | Keep cap; event-week exception |
| Singapore (CBD) | SGD 320 | SGD 410 | SGD 480 | 12% | Raise cap to SGD 420 |
| London (City) | £210 | £235 | £289 | 33% | Raise cap to £240 |
| Pune (Hinjewadi) | ₹7,500 | ₹5,400 | ₹6,500 | 91% | Lower cap to ₹6,500 |
Results Achieved
| Metric | Outcome (illustrative) |
|---|---|
| Cities benchmarked | 40 |
| Caps raised | 11 cities |
| Caps lowered | 9 cities |
| Out-of-policy hotel bookings | Down 38% in the following quarter |
| Estimated annual hotel spend change | 4% saving despite higher caps in expensive cities |
Lowering caps where rates were well below them offset raising caps in expensive cities. Employees found compliant hotels more easily, and approvals for exceptions fell sharply.
Event-week exceptions
Weekly data also showed rate spikes during trade fairs and conferences. The client added an "event-week" rule allowing a temporary higher cap in specific cities during known events, based on the data.
How the monthly report is structured
| Section | Content |
|---|---|
| Summary | Cities where caps look too low or too high this month |
| City detail | Median, 75th percentile, share within cap, weekday vs weekend |
| Event calendar | Upcoming events that may push rates up |
| Negotiated hotels | Negotiated rate vs public rate for preferred hotels |
| Recommendations | Proposed cap changes with supporting data |
The finance team reviews the report quarterly and approves cap changes, while the travel team uses the monthly view to brief travellers about expensive periods.
Why it worked
- Office-specific zones made benchmarks relevant to where employees actually stay.
- Consistent rate definitions matched the policy wording.
- Percentiles, not averages, gave a fair picture of what was available.
- Monthly reviews kept caps current.
Validate your travel policy with data
Travel Data Scrape delivers corporate hotel rate scraping and city benchmarks for travel managers and finance teams. Share your cities and policy caps, and we will send a sample benchmark for five cities.
FAQs
Unlock the Full Report
Enter your details to access premium pricing intelligence insights