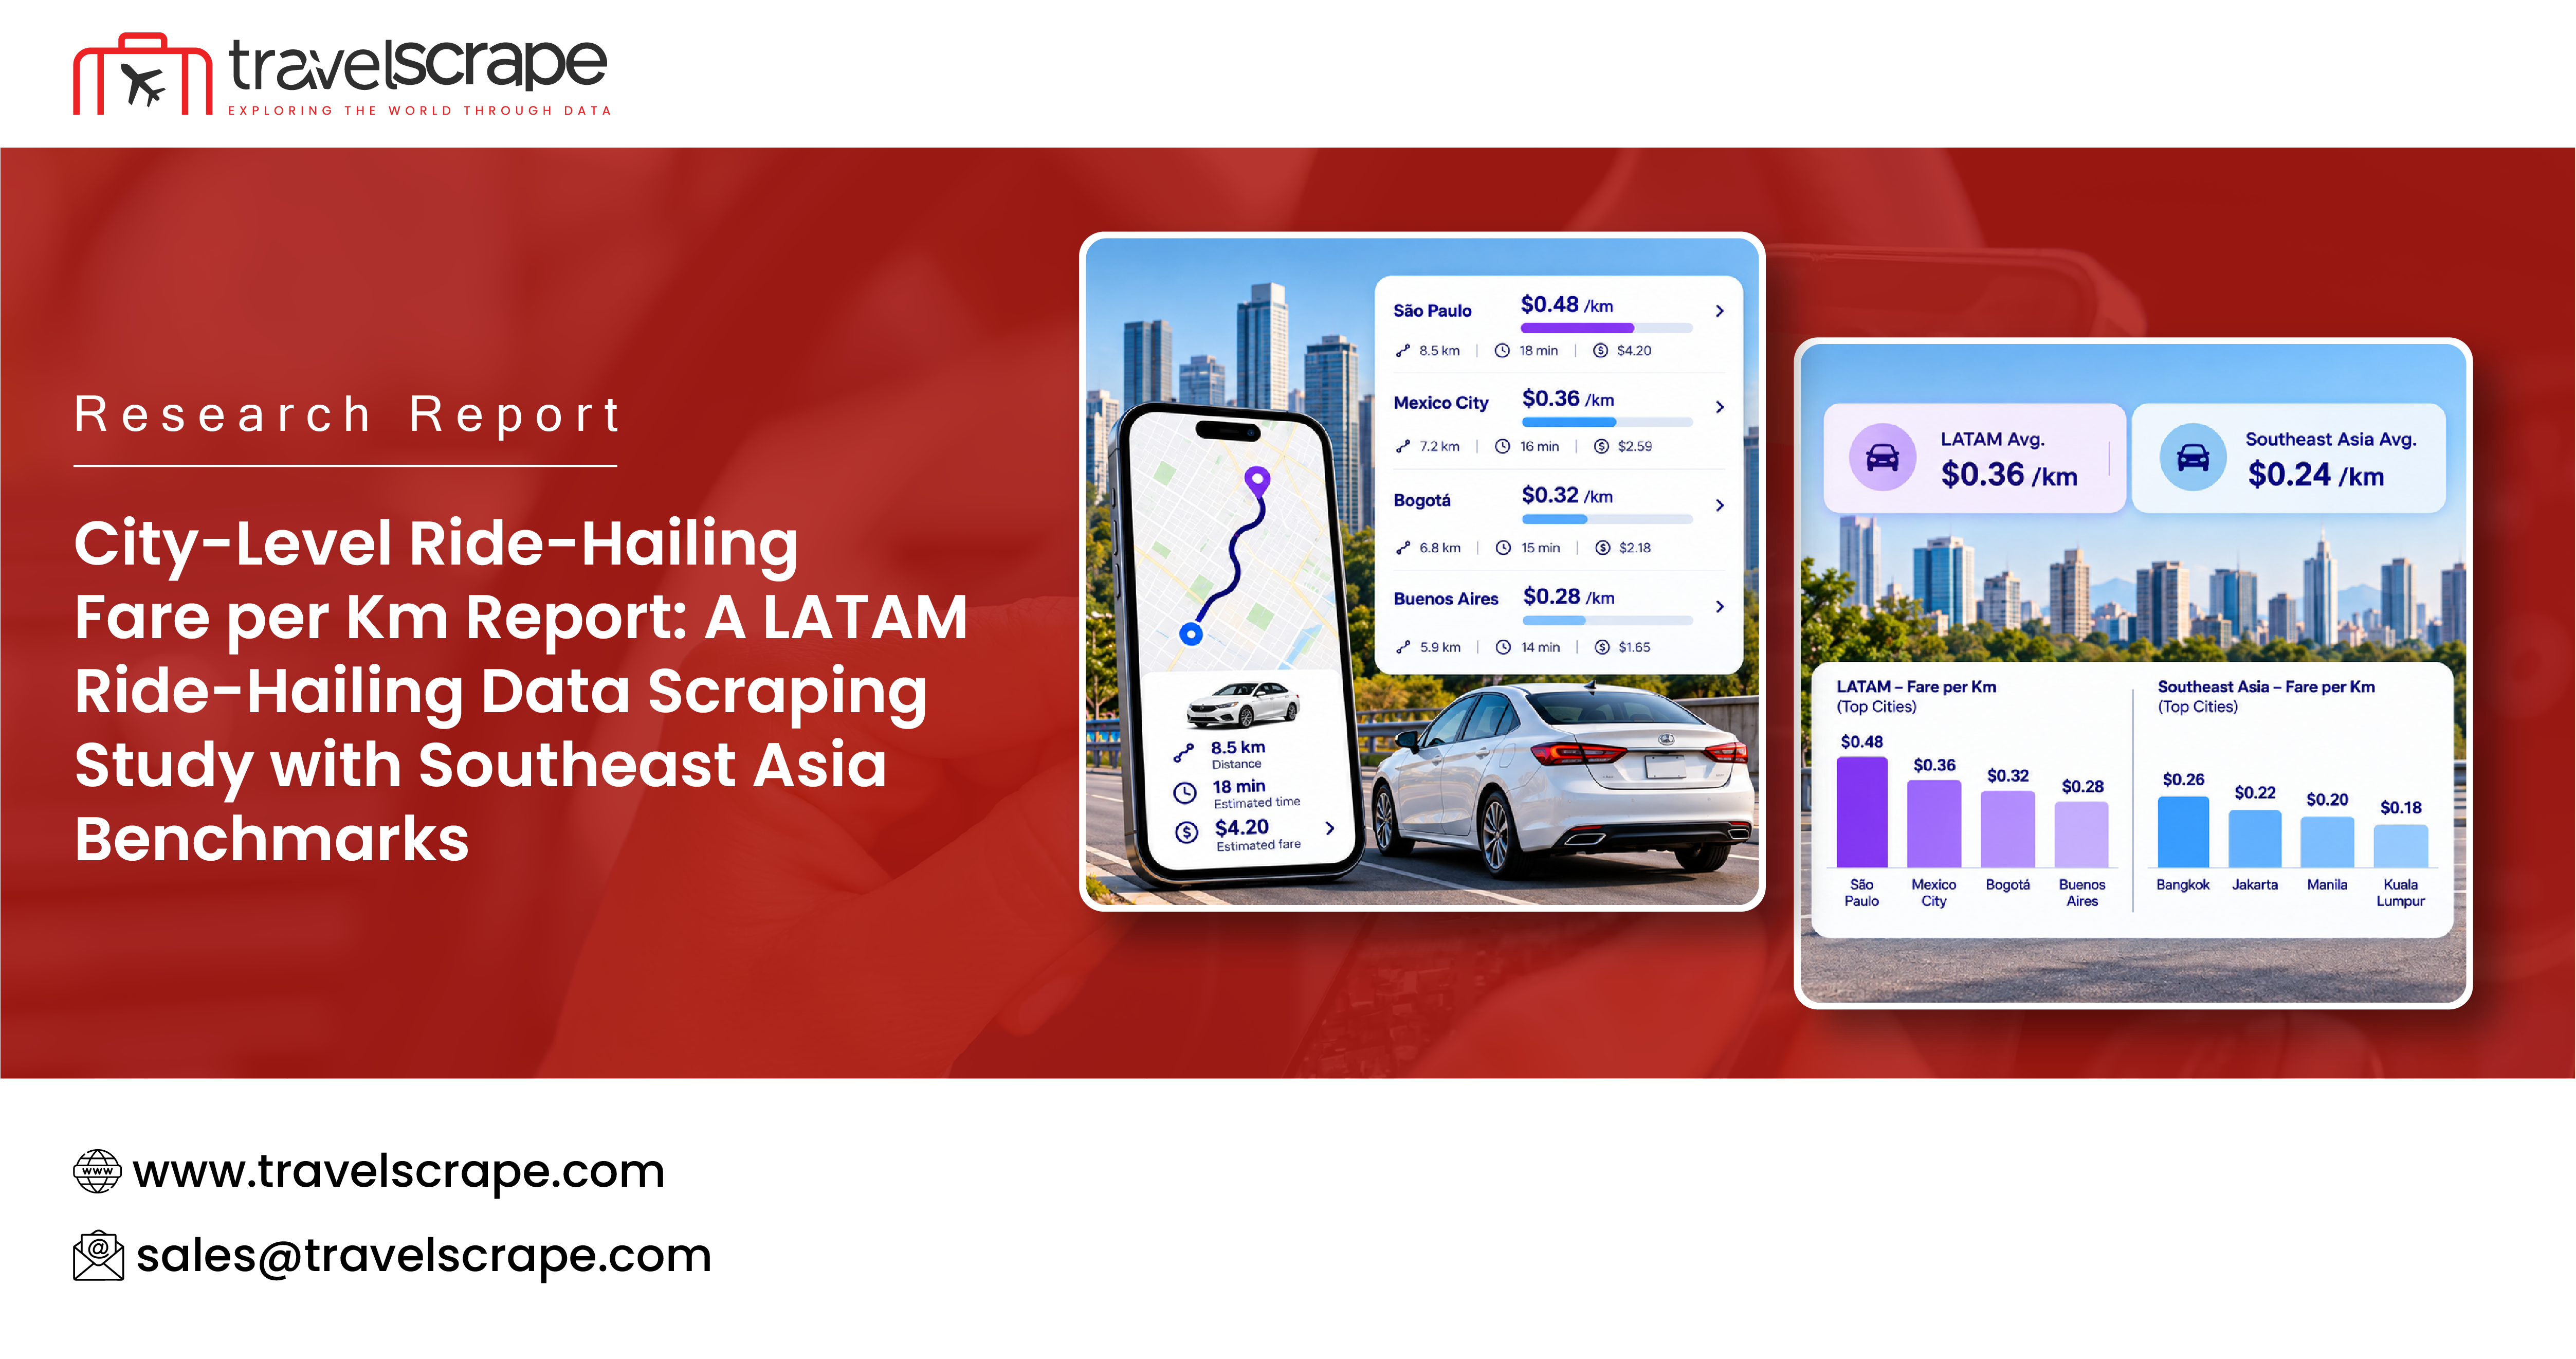
City-Level Ride-Hailing Fare per Km Report: A LATAM Ride-Hailing Data Scraping Study with Southeast Asia Benchmarks
Executive summary
Ride-hailing is a daily habit in Latin American and Southeast Asian cities, and the economics of each trip matter to many groups: drivers deciding whether to finance a vehicle, fleet operators choosing cities for electric vehicles, investors comparing markets, and city planners studying mobility costs. Yet consistent, city-level fare data is hard to find.
In 2026 Travel Data Scrape received requests for exactly this data. A Colombian client wanted "average fare per trip and average fare per kilometre, at city level, with the broadest possible coverage." A US-based mobility company asked for "global data covering ride-hailing metrics at the city level." A client in Singapore wanted live fares for Grab, TADA and Gojek. This report shows how LATAM Ride-Hailing Data Scraping produces comparable fare-per-km figures across cities, with Southeast Asian cities as benchmarks.
Key illustrative findings:
- Median fare per km varies more than threefold across the cities in the sample.
- Short trips cost far more per km than long trips everywhere, because of base fares and minimums.
- Peak-hour fares are 20% to 45% higher than off-peak in most cities.
- Economy and motorbike options narrow the cost gap with public transport in several Southeast Asian cities.
- Fare per km tracks local incomes and fuel prices more closely than it tracks platform choice.
Why fare per km is the right metric
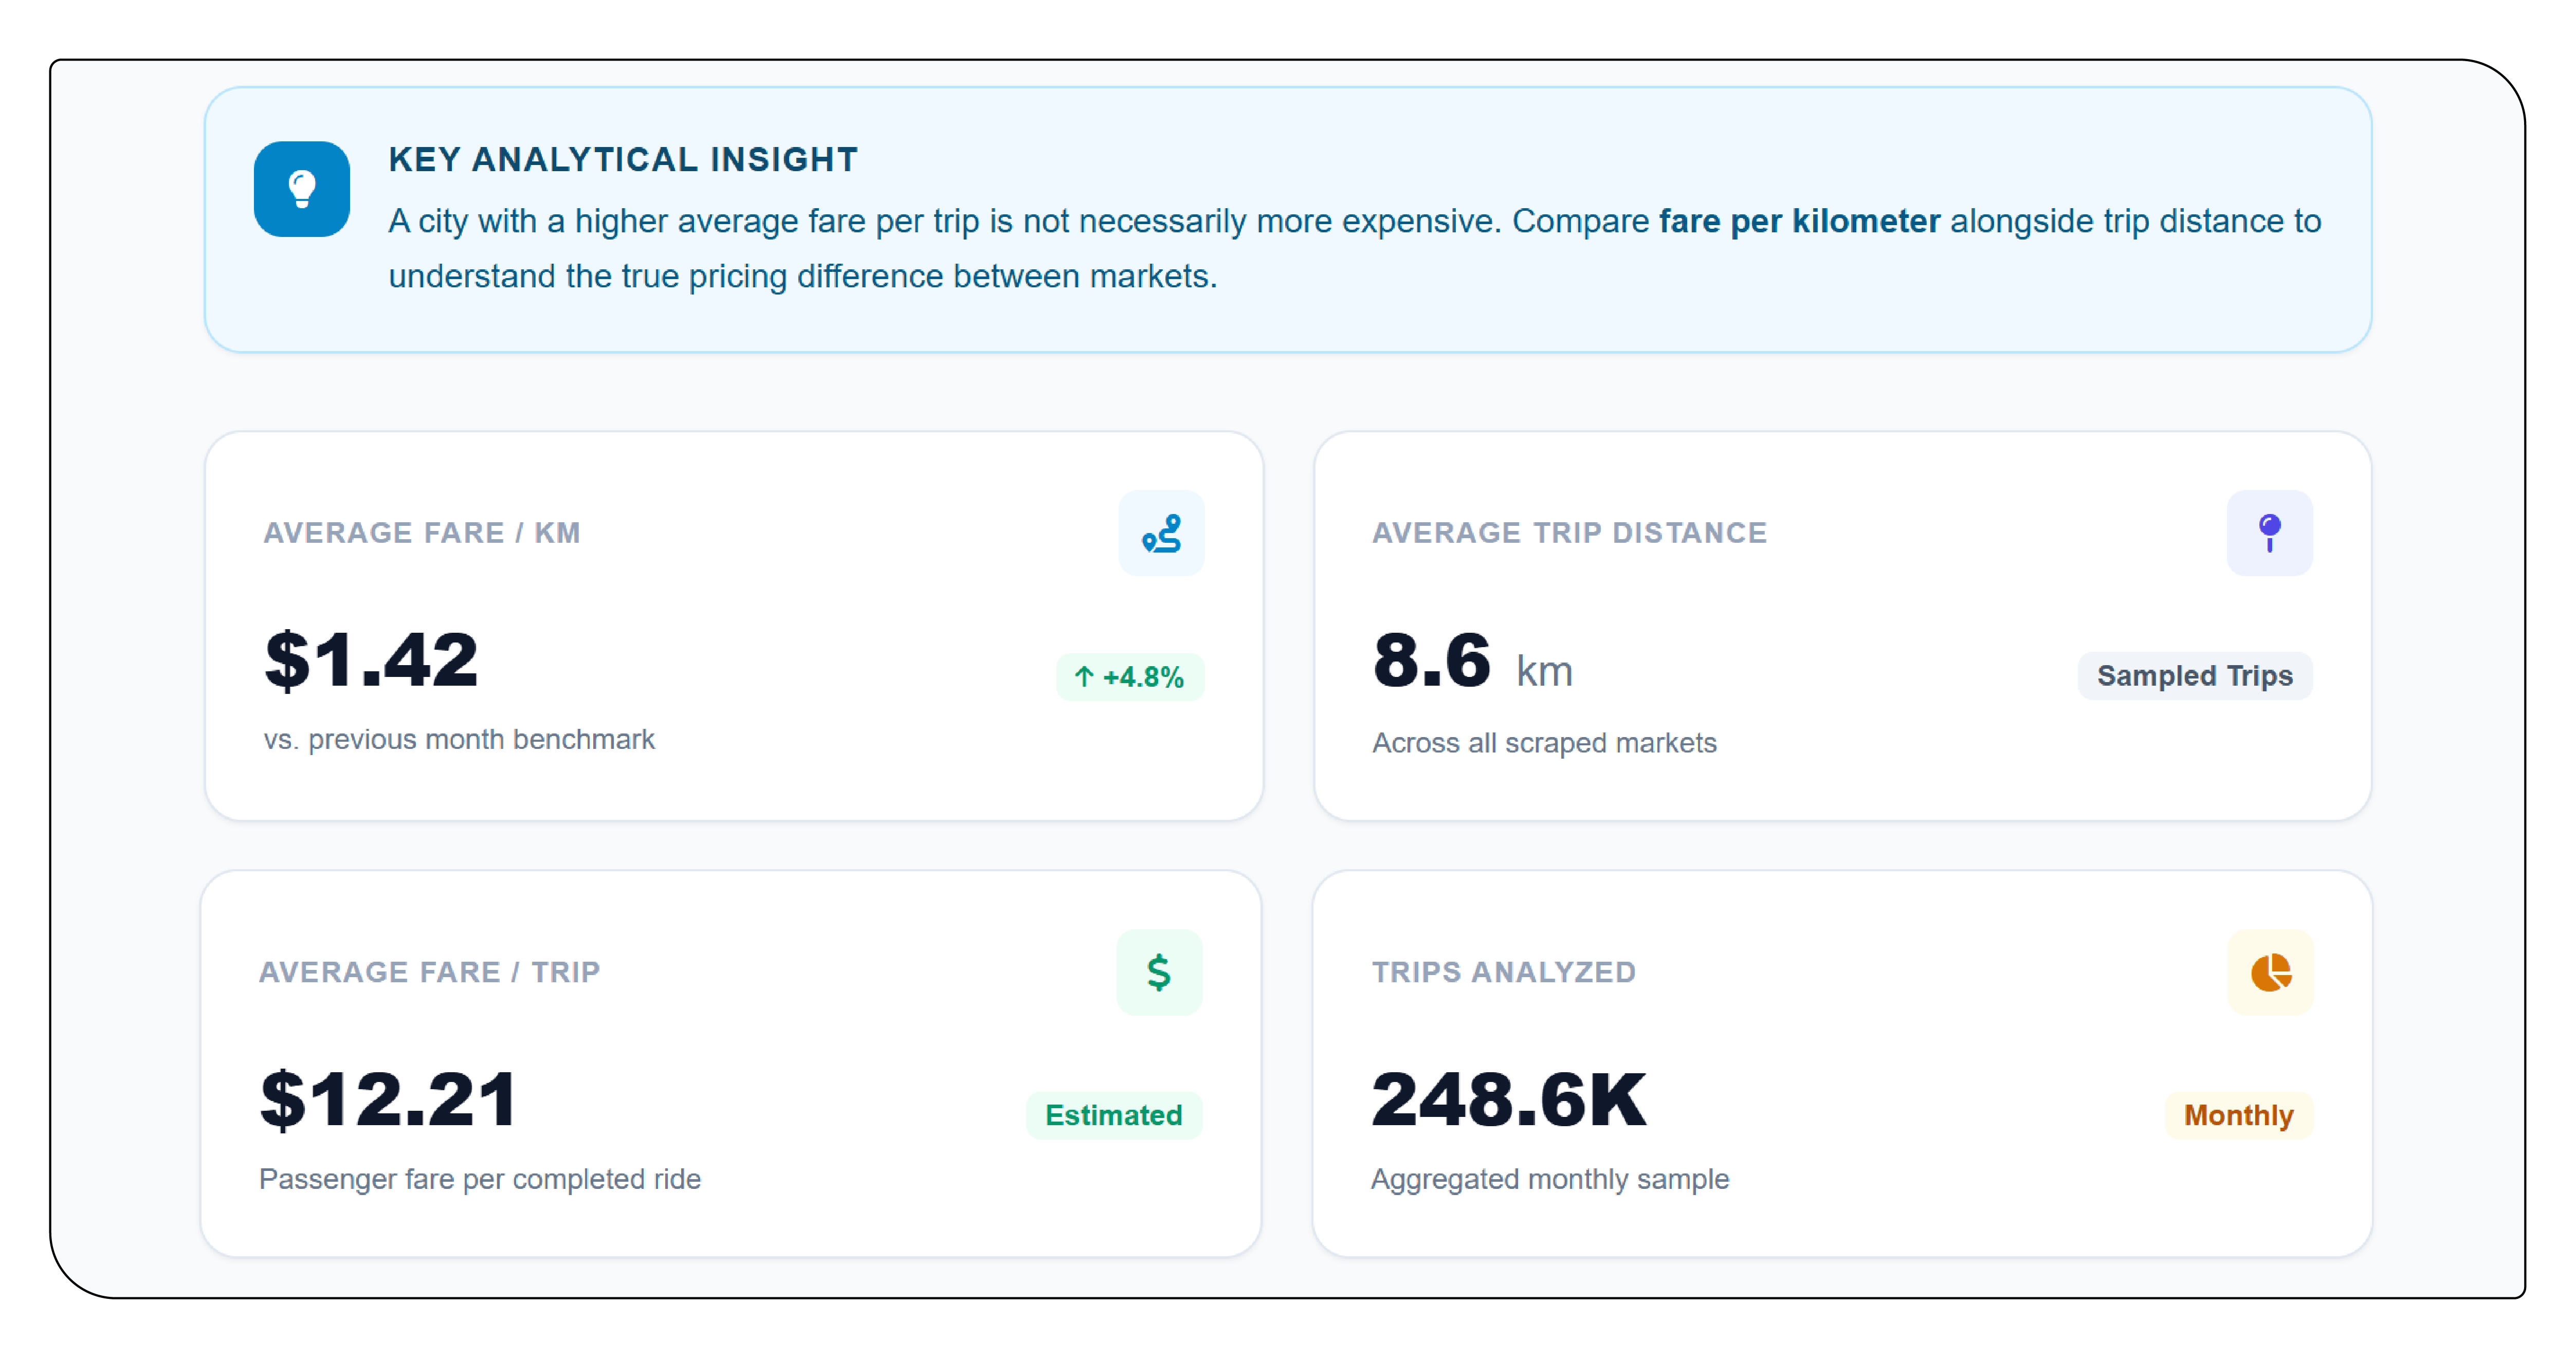
Average fare per trip depends on how far people travel, which differs by city shape and habits. Fare per km removes much of that difference and makes cities comparable. Combined with average trip length, it allows analysts to estimate driver revenue, fleet economics and consumer spending.
Methodology
Cities
| Region | Cities in the illustrative sample |
|---|---|
| Latin America | Bogotá, Medellín, Mexico City, Monterrey, São Paulo, Rio de Janeiro, Buenos Aires, Santiago, Lima |
| Southeast Asia (benchmark) | Singapore, Jakarta, Bangkok, Manila, Kuala Lumpur, Ho Chi Minh City |
Platforms
Major platforms operating in each city were included where public fare estimates are available, such as Uber, DiDi, Cabify and InDrive in Latin America, and Grab, Gojek and TADA in Southeast Asia, depending on the city.
Route sample
For each city, 60 fixed origin-destination pairs were defined across three distance bands:
| Band | Distance | Typical trip |
|---|---|---|
| Short | 2 to 5 km | Within a neighbourhood or to a metro station |
| Medium | 5 to 12 km | Home to office |
| Long | 12 to 30 km | Airport or cross-city trip |
Time slots
Fare estimates were collected at five time slots on weekdays and two on weekends: early morning, morning peak, midday, evening peak, late night, weekend afternoon and weekend night.
Ride types
The most common economy car option was the primary ride type. Premium, XL and motorbike options were recorded where available.
Collection
LATAM ride-hailing data scraping collected the fare estimate shown to a rider before booking, through app-based and web-based public estimate tools, without booking trips. Each observation recorded platform, city, route, distance, estimated duration, ride type, fare estimate (or range), surge or dynamic pricing indicators where shown, time slot and date.
Calculation
For each observation, fare per km = fare estimate ÷ route distance. Where a range was shown, the midpoint was used. City medians were calculated by band and time slot, then converted to US dollars at dated reference exchange rates.
Key findings
Median economy fare per km by city
| City | Median fare per km (local) | Median fare per km (USD) | Median fare, medium trip (USD) |
|---|---|---|---|
| Santiago | CLP 690 | 0.73 | 6.20 |
| São Paulo | BRL 2.90 | 0.53 | 4.50 |
| Mexico City | MXN 9.80 | 0.54 | 4.60 |
| Monterrey | MXN 9.20 | 0.51 | 4.30 |
| Buenos Aires | ARS 520 | 0.44 | 3.70 |
| Rio de Janeiro | BRL 2.60 | 0.47 | 4.00 |
| Lima | PEN 1.65 | 0.44 | 3.70 |
| Bogotá | COP 1,750 | 0.42 | 3.60 |
| Medellín | COP 1,600 | 0.39 | 3.30 |
| Singapore | SGD 1.55 | 1.18 | 10.00 |
| Kuala Lumpur | MYR 1.45 | 0.33 | 2.80 |
| Bangkok | THB 13.5 | 0.38 | 3.20 |
| Jakarta | IDR 5,900 | 0.37 | 3.10 |
| Manila | PHP 22 | 0.39 | 3.30 |
| Ho Chi Minh City | VND 9,000 | 0.36 | 3.00 |
All values illustrative.
Singapore stands apart as the most expensive city in the sample. Among Latin American cities, Santiago shows the highest fare per km, while Colombian cities sit at the lower end.
Fare per km by distance band
| Band | LATAM median (USD/km) | SEA median excl. Singapore (USD/km) |
|---|---|---|
| Short (2–5 km) | 0.78 | 0.62 |
| Medium (5–12 km) | 0.47 | 0.36 |
| Long (12–30 km) | 0.36 | 0.29 |
All values illustrative.
Short trips cost about twice as much per km as long trips, because base fares and minimum fares weigh more heavily on short distances.
Peak vs off-peak
| City group | Morning peak vs midday | Evening peak vs midday | Late night vs midday |
|---|---|---|---|
| Latin America | +24% | +38% | +12% |
| Southeast Asia | +21% | +33% | +9% |
All values illustrative.
Evening peaks show the largest increases, often combined with rain or events in individual cities.
Ride-type ladder
| Ride type | Index vs economy car (=100), LATAM | Index vs economy car (=100), SEA |
|---|---|---|
| Motorbike (where available) | 55 | 50 |
| Economy car | 100 | 100 |
| Comfort or premium | 135 | 140 |
| XL (6 seats) | 165 | 170 |
All values illustrative.
Platform spread within cities
Within a single city, the median difference between the cheapest and most expensive major platform for the same route and time was 8% to 15% in the sample. City-level factors such as fuel prices, regulation and local wage levels explained much more of the variation than platform choice.
Fare per km and local context
When fare per km is compared with local fuel prices and average incomes, a clear pattern appears: cities with higher fuel prices and higher incomes have higher fares per km. For EV fleet operators, the gap between fare per km and energy cost per km is a key input for choosing launch cities.
Airport trips
| City (illustrative) | Airport trip distance (km) | Median economy fare (USD) | Fare per km (USD) |
|---|---|---|---|
| Bogotá (El Dorado) | 14 | 7.10 | 0.51 |
| Mexico City (AICM) | 11 | 6.30 | 0.57 |
| São Paulo (Guarulhos) | 28 | 15.40 | 0.55 |
| Lima (Jorge Chávez) | 16 | 8.20 | 0.51 |
| Santiago (SCL) | 21 | 13.10 | 0.62 |
All values illustrative.
Airport trips often carry surcharges or fixed pickup fees, which raise fare per km above the city's medium-trip median even on long distances.
Implications for EV fleet economics
For an EV fleet operator, the useful comparison is fare per km against cost per km. If a city's median economy fare is around USD 0.45 per km and electricity plus maintenance costs are a fraction of that, the margin available to cover vehicle financing, platform commission and driver earnings can be estimated city by city. Cities with higher fares per km and lower electricity costs are natural early markets, provided charging infrastructure is in place. LATAM ride-hailing data scraping supplies the fare side of this equation with a level of detail that general market reports rarely provide.
Sample data
The record below shows the structure of one observation.
{
  "city": "Bogotá",
  "country": "Colombia",
  "platform": "Example Ride",
  "route_id": "BOG-M-017",
  "distance_band": "medium",
  "route_km": 8.4,
  "est_duration_min": 31,
  "ride_type": "economy_car",
  "time_slot": "evening_peak",
  "day_type": "weekday",
  "fare_estimate_local": 18900,
  "currency": "COP",
  "fare_per_km_local": 2250,
  "fare_per_km_usd": 0.54,
  "dynamic_pricing_indicator": true,
  "collected_at": "2026-10-06T18:20:00-05:00"
}
How different organisations use the data
- EV fleet and driver-financing companies estimate driver revenue per km and choose launch cities.
- Mobility investors compare market economics across countries.
- Ride-hailing operators benchmark pricing against competitors by city and time.
- City planners and researchers compare ride-hailing costs with public transport.
- Insurers and lenders assess the earning capacity of drivers in each city.
Limitations
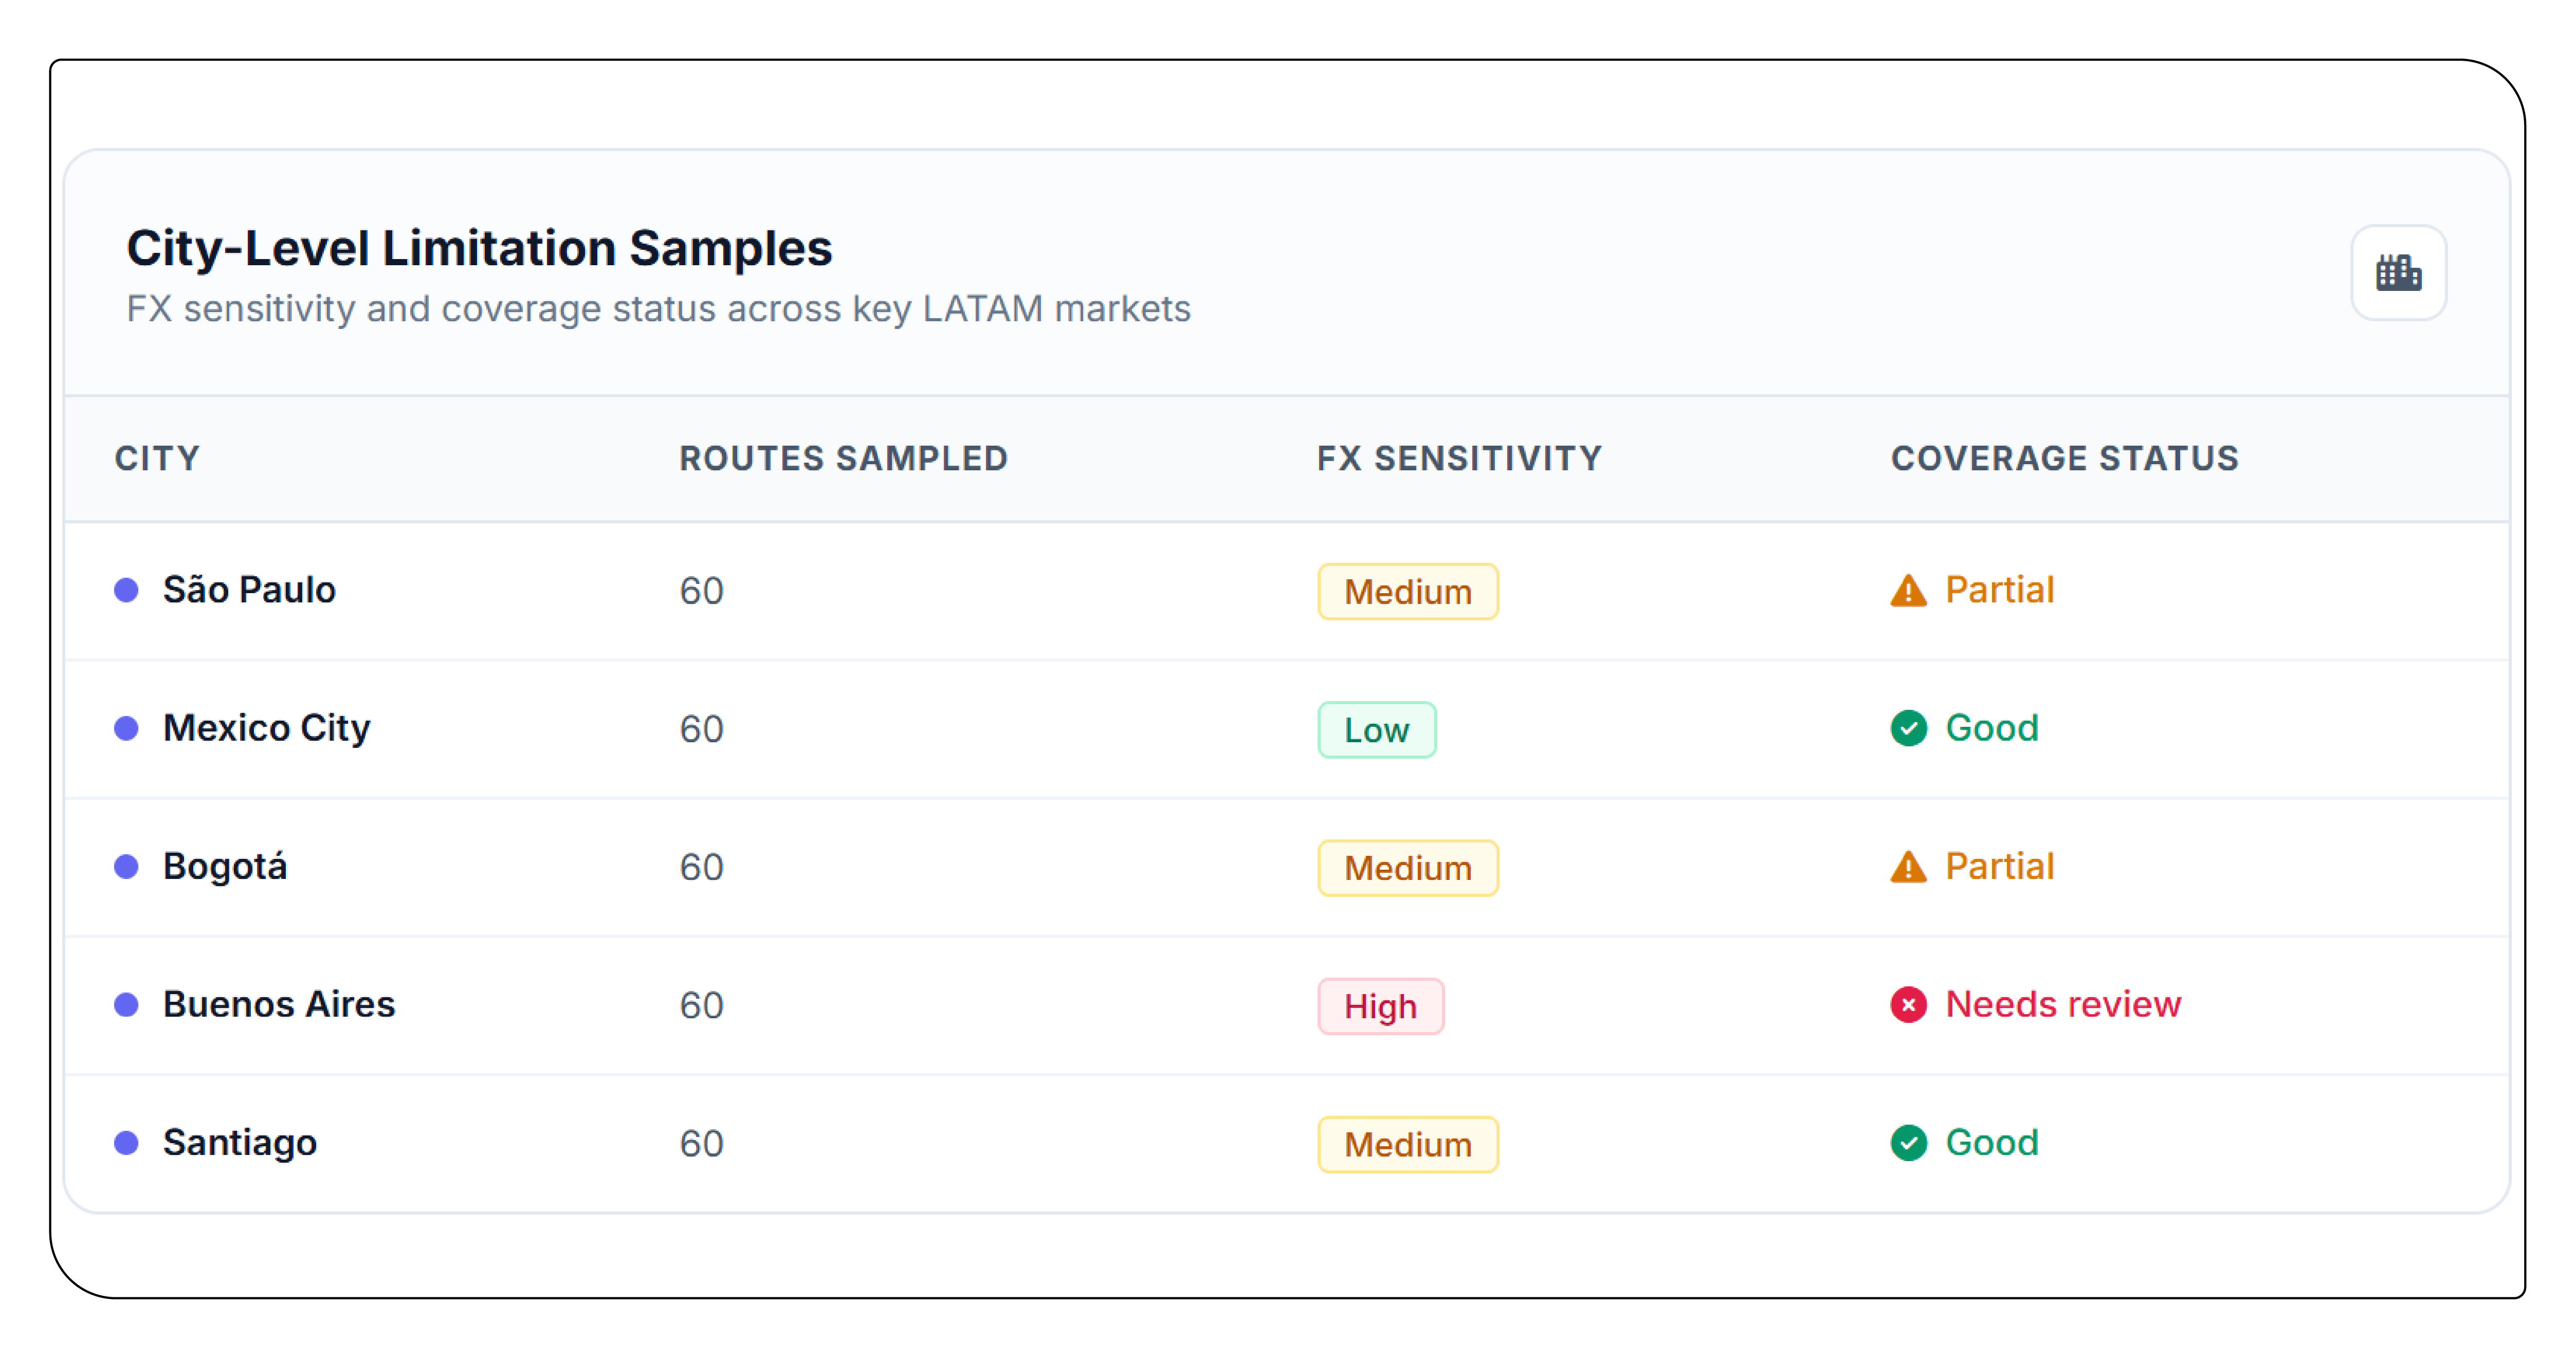
- Fare estimates shown before booking may differ slightly from final fares paid.
- Dynamic pricing changes minute by minute; time-slot medians smooth this variation.
- The route sample covers 60 routes per city and may not represent all trip patterns.
- Platform availability and features vary by city.
- Currency conversion uses dated reference rates; local inflation affects comparisons over time, particularly in Argentina.
Frequently asked questions
Can LATAM ride-hailing data scraping cover more cities?
Yes. Additional cities in Latin America, Southeast Asia, the Middle East and Africa can be added with the same method.
Can you provide trip volumes or driver counts?
Platforms do not publish these at city level. This study focuses on publicly visible fare estimates.
How often should fares be collected?
Monthly for market benchmarks; weekly or daily for operators and investors tracking pricing changes.
Is any personal data collected?
No. No rider, driver or account data is collected, and no trips are booked.
Conclusion
City-level fare per km is one of the most useful single metrics in urban mobility. LATAM ride-hailing data scraping makes it measurable across platforms and cities, and Southeast Asian benchmarks put Latin American markets in context. The illustrative results show wide differences between cities, strong distance and time-of-day effects, and a close link between fares and local economic conditions.
Commission a live fare-per-km benchmark from Travel Data Scrape
Travel Data Scrape delivers LATAM ride-hailing data scraping and global city-level mobility benchmarks for investors, fleet operators and mobility companies. Share your cities and ride types, and we will prepare a pilot benchmark.
Unlock the Full Report
Enter your details to access premium pricing intelligence insights