
Scrape Ride-Hailing Fare Per Trip vs Fare Per Kilometer Data: Why Ride-Hailing Investors Need Both Metrics at City Level?
Introduction
Urban mobility platforms constantly adjust fares according to distance, demand, vehicle category, location, traffic, time, and availability. For businesses analyzing transportation markets, comparing the total cost of a ride with the underlying distance-based economics provides a more complete view of pricing behavior. Scrape ride-hailing fare per trip vs fare per kilometer data to understand how platforms structure prices across cities, routes, vehicle types, and time periods.
Price Monitoring becomes particularly important when ride-hailing platforms frequently change base fares, minimum charges, surge components, booking fees, and per-kilometer rates. A structured dataset can help analysts identify pricing changes and benchmark competing services without relying on isolated observations.
For investors, operators, mobility researchers, and market intelligence teams, ride-hailing investor metrics analytics can connect fare trends with trip volumes, estimated revenue indicators, market expansion, and competitive positioning. Instead of examining one fare metric independently, businesses can evaluate the broader relationship between price, distance, demand, and market activity.
Understanding Fare Per Trip vs Fare Per Kilometer
Fare per trip represents the total amount a customer pays for a ride, while fare per kilometer normalizes that amount against the distance traveled.
For example, consider two hypothetical rides:
| Platform | Distance | Total Fare | Fare/KM |
|---|---|---|---|
| Uber | 5 km | $9.50 | $1.90 |
| Lyft | 5 km | $11.00 | $2.20 |
| Bolt | 5 km | $10.25 | $2.05 |
| Uber | 15 km | $22.50 | $1.50 |
| Lyft | 15 km | $25.50 | $1.70 |
| Bolt | 15 km | $24.00 | $1.60 |
The table demonstrates why total trip fare alone can be misleading. A platform may appear expensive for short journeys because of minimum fares or fixed booking charges, while its effective per-kilometer cost could become lower on longer journeys.
Conversely, a low advertised per-kilometer rate does not necessarily mean the final customer fare is lower. Taxes, platform fees, waiting charges, tolls, surge pricing, and minimum fares can materially affect the final amount.
Why Ride-Hailing Fare Comparison Matters?
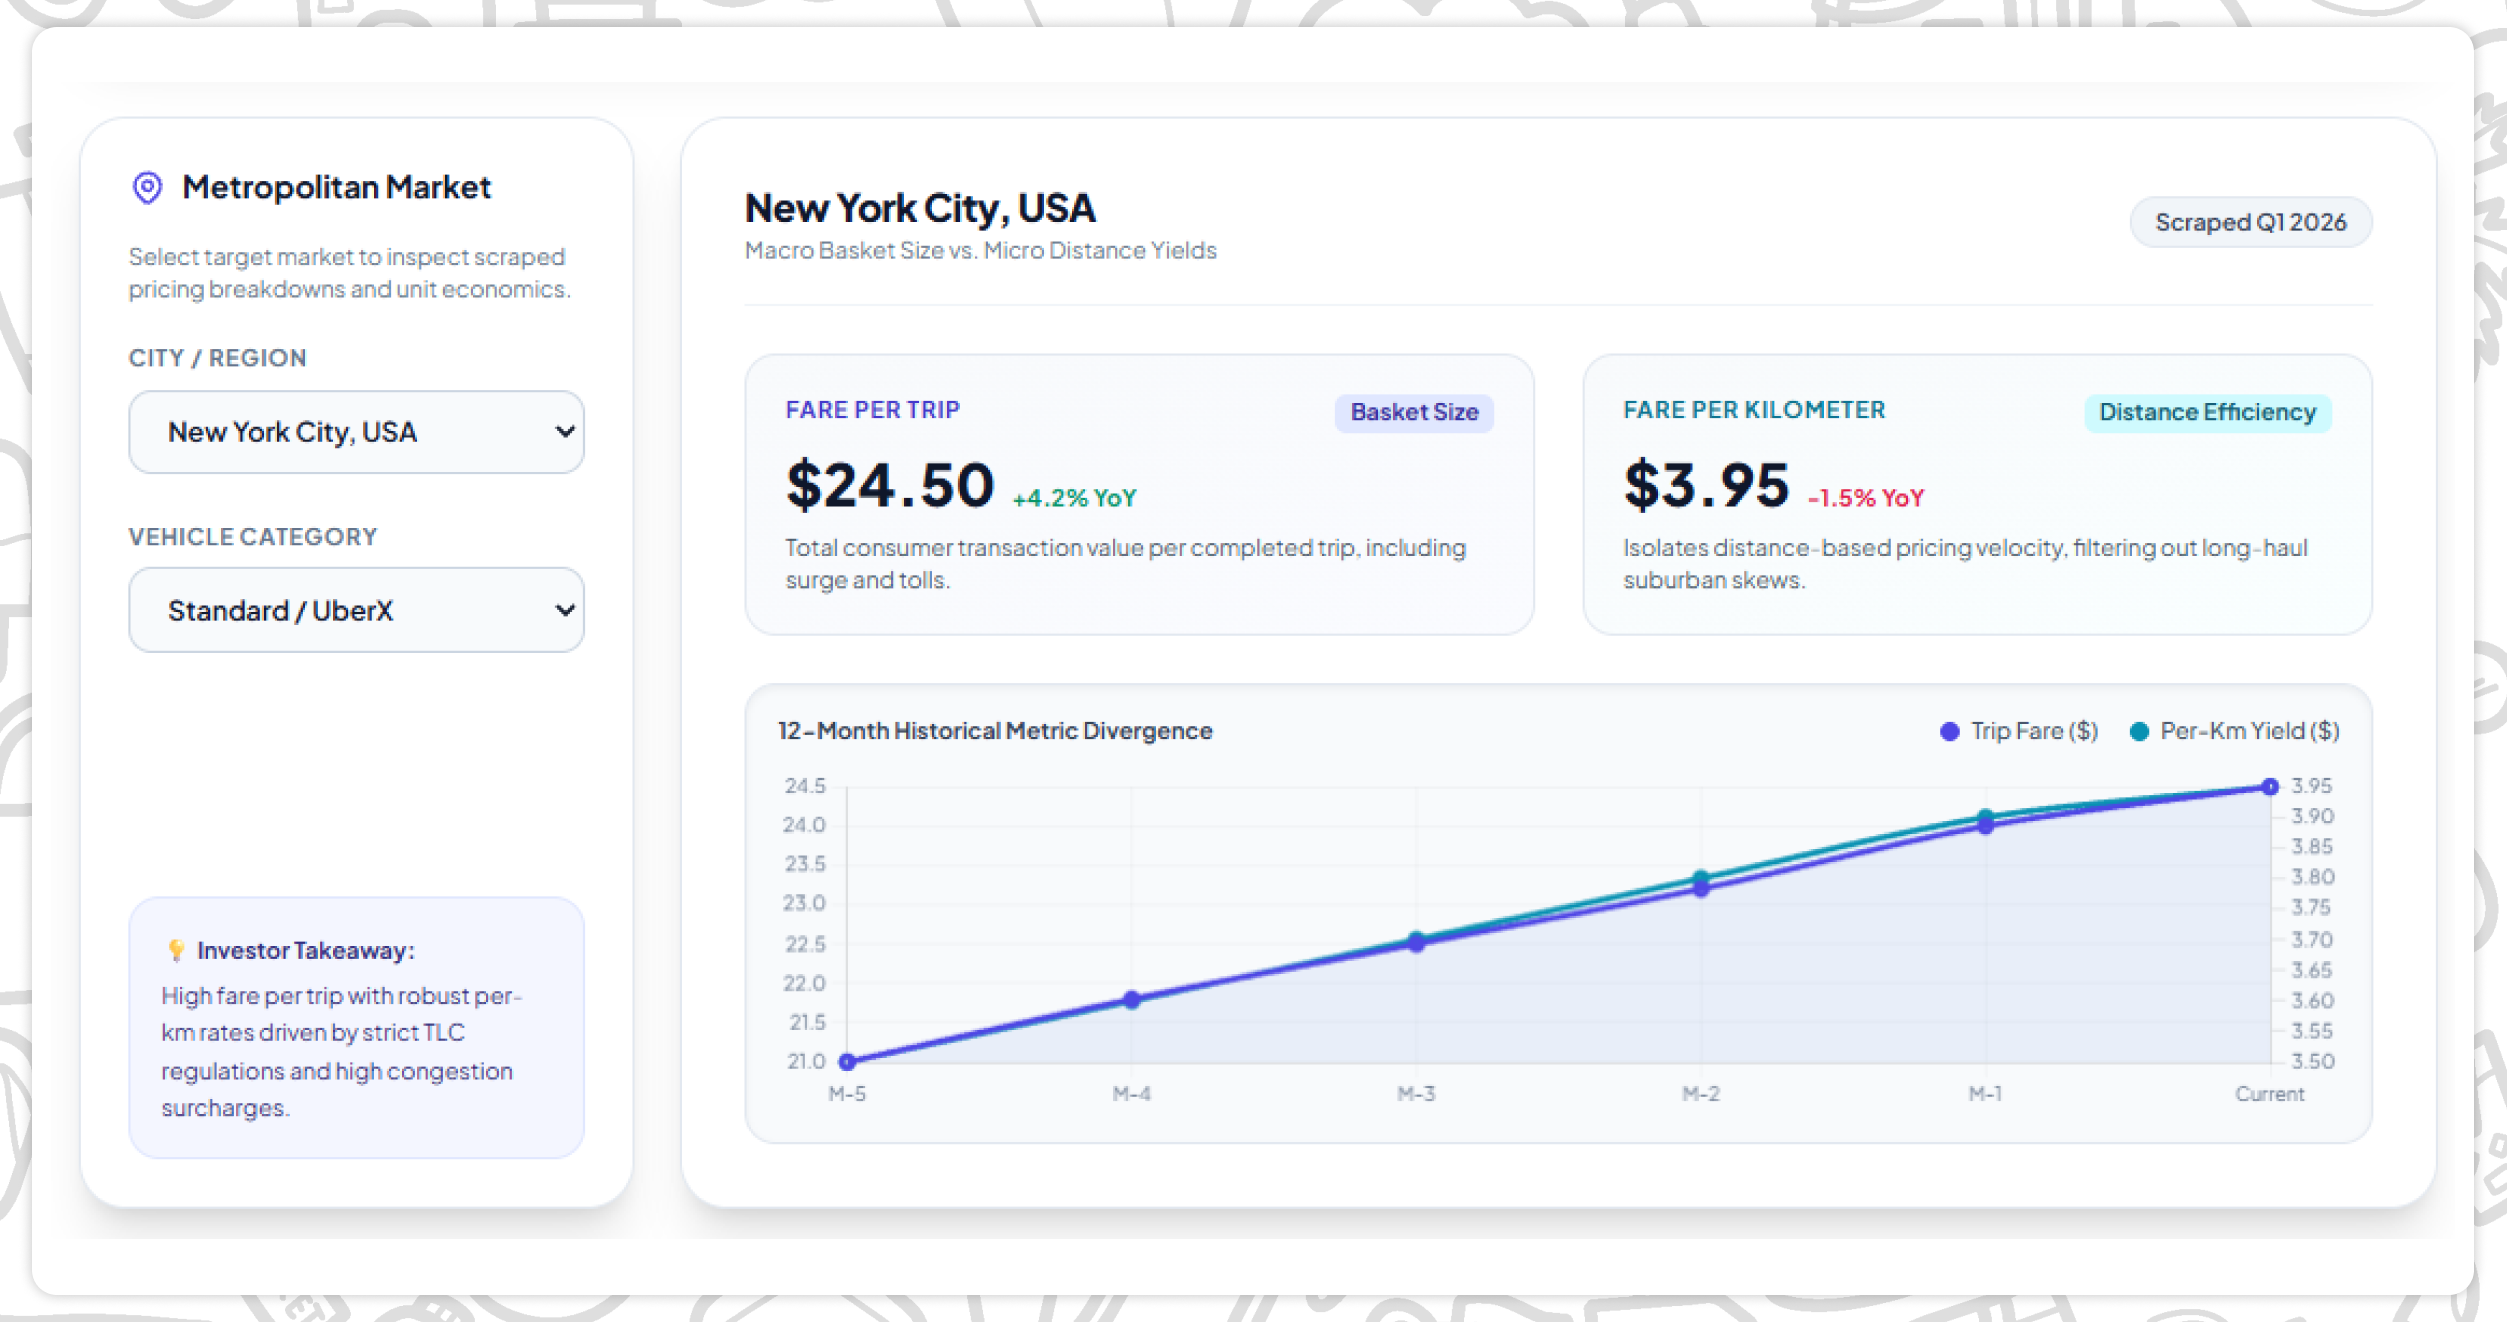
The economics of ride-hailing are highly location-specific. A fare structure that works in one metropolitan market may look very different in another because of local regulations, traffic conditions, consumer demand, vehicle availability, and competitive intensity.
Businesses can collect information across:
- Cities and neighborhoods
- Vehicle categories
- Pickup and drop-off locations
- Trip distances
- Estimated travel duration
- Base fares
- Per-kilometer charges
- Booking fees
- Taxes
- Surge or dynamic pricing
- Discounts and promotions
- Cancellation charges
- Waiting charges
- Tolls and additional fees
This information enables ride-hailing pricing intelligence by transforming individual fare observations into comparable datasets.
Key Metrics to Track
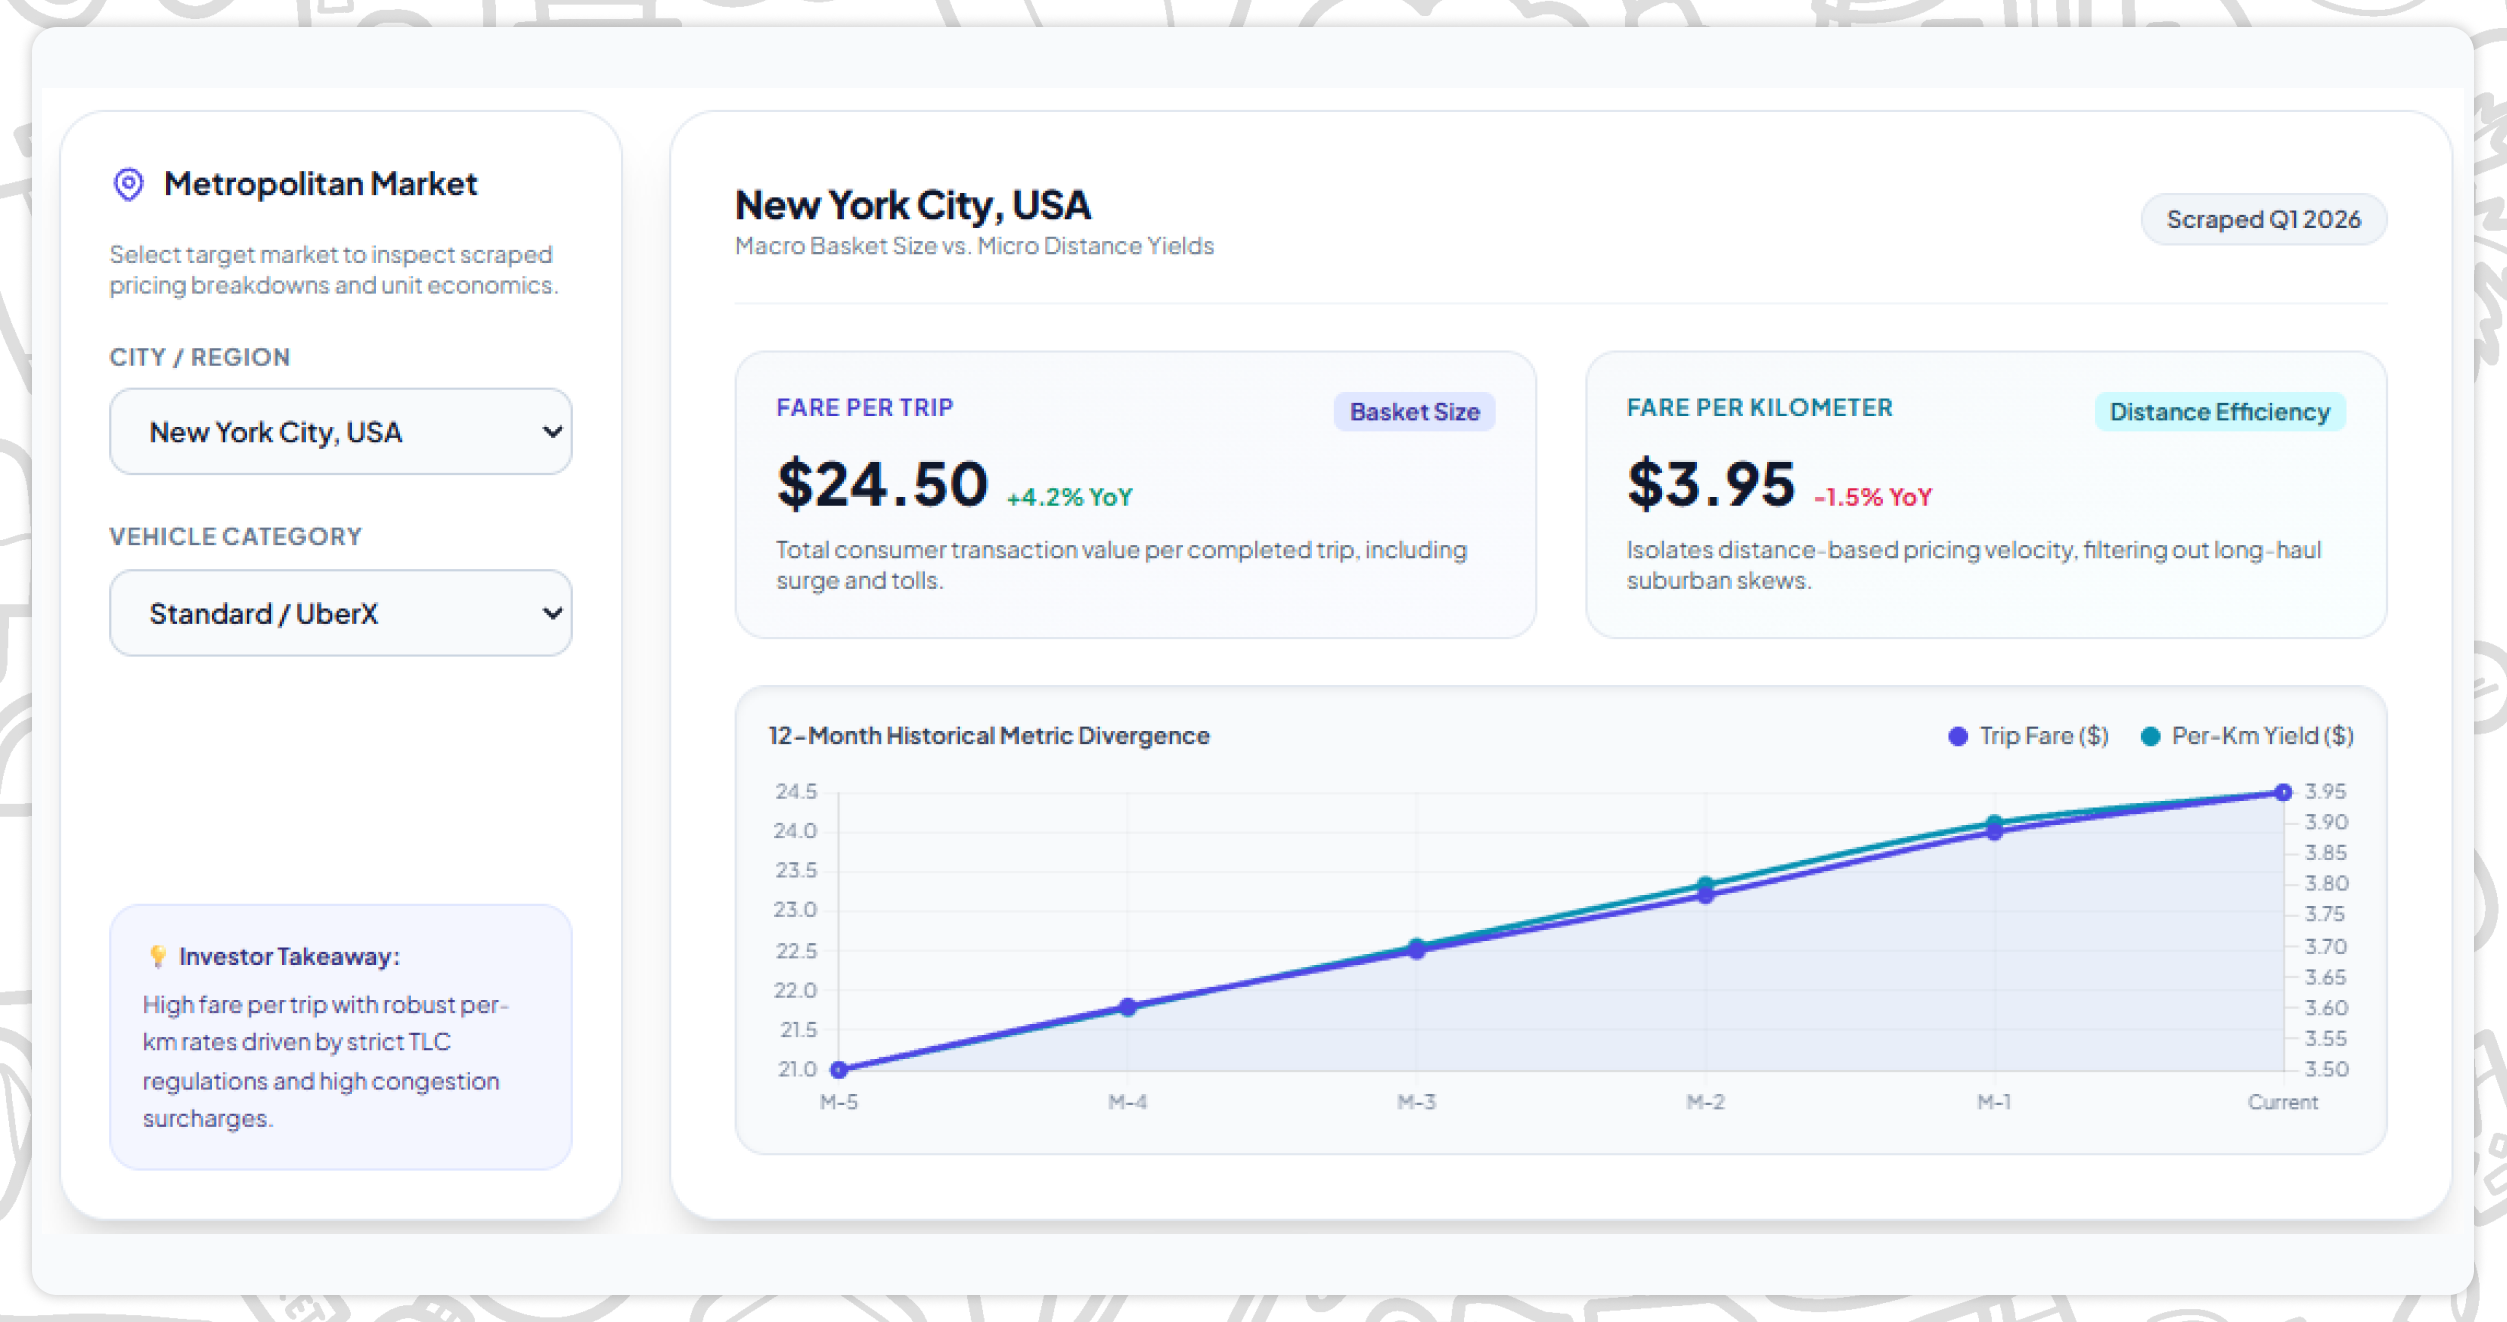
A robust fare dataset should go beyond simply recording the displayed price.
Fare Per Trip
Track the total estimated fare for identical or comparable journeys. This helps identify differences in customer-facing pricing between platforms.
Fare Per Kilometer
Divide the total fare by estimated distance to create a normalized metric. This is particularly useful when comparing short, medium, and long-distance journeys.
Base Fare
Capture the initial charge applied before distance- or time-based components are added.
Estimated Distance
Record the platform's estimated route distance so the effective fare-per-kilometer calculation can be reproduced.
Estimated Duration
Travel time can explain why two journeys covering similar distances have substantially different prices.
Surge Multiplier
Where displayed, capture dynamic pricing indicators to understand how demand conditions influence fare levels.
Fare Components
Separating base fare, distance charge, time charge, booking fee, taxes, tolls, and other components provides much greater analytical depth.
How Scraping Supports Real-Time Fare Intelligence?
Ride-hailing prices can change throughout the day. Morning commuting periods, evening demand, weekends, holidays, weather events, airport traffic, and major local events can create significant variations.
Real-Time Price Intelligence enables organizations to capture repeated fare observations and construct a time-series dataset.
For example, a monitoring system could collect comparable journeys every 15, 30, or 60 minutes. Over several weeks, analysts could examine:
- Morning versus evening pricing
- Weekday versus weekend fares
- Peak versus off-peak pricing
- Short-trip versus long-trip economics
- City-level fare differences
- Vehicle-category pricing
- Surge frequency
- Average fare per kilometer
- Fare volatility
This transforms static price checks into a continuous market-monitoring framework.
City-Level Fare Data Collection
Different cities can have dramatically different fare structures. city-level ride-hailing data scraping allows organizations to compare these markets systematically.
A city-level dataset can include fields such as:
| City | Platform | Vehicle Type | Distance | Fare | Fare/KM | Duration | Time |
|---|---|---|---|---|---|---|---|
| Mumbai | Uber | Economy | 7.2 km | ₹184 | ₹25.56 | 24 min | 9 AM |
| Delhi | Uber | Economy | 7.2 km | ₹169 | ₹23.47 | 21 min | 9 AM |
| Bengaluru | Uber | Economy | 7.2 km | ₹201 | ₹27.92 | 29 min | 9 AM |
| Hyderabad | Uber | Economy | 7.2 km | ₹158 | ₹21.94 | 20 min | 9 AM |
Such datasets help businesses detect geographical pricing patterns instead of assuming that one market represents the entire platform.
Building a Fare Per Kilometer Comparison Dataset
A fare per km comparison dataset across ride-hailing platforms can be designed around standardized routes.
For reliable benchmarking, businesses can define:
- Standard distances
- Fixed pickup zones
- Fixed destination zones
- Specific vehicle categories
- Collection time intervals
- Comparable traffic periods
- Multiple observations per route
The same route can then be monitored across competing platforms.
For instance, a 5-kilometer urban route could be collected repeatedly throughout the day. The resulting dataset might show that one service has a higher minimum fare, another responds more aggressively to peak demand, and another maintains relatively stable pricing.
The goal is not merely to find the cheapest ride. Instead, the dataset can reveal how different pricing mechanisms operate.
Ride-Hailing Market Data Analysis
Once sufficient observations have been accumulated, organizations can conduct ride-hailing market data analysis across multiple dimensions.
Pricing Trends
Calculate daily, weekly, and monthly changes in average fare per trip and fare per kilometer.
Competitive Benchmarking
Compare platforms using equivalent routes, vehicle categories, distances, and collection periods.
Geographic Analysis
Identify markets where average ride costs are higher or lower than broader regional benchmarks.
Demand-Price Relationships
Combine fare observations with available demand indicators, trip volumes, or surge observations to understand market dynamics.
Route-Level Analysis
Determine which routes consistently experience higher effective pricing.
Combining Fare Data With Trip Volume
Fare data becomes considerably more valuable when combined with trip-volume indicators.
Consider the following simplified dataset:
| City | Avg Fare/Trip | Avg Fare/KM | Estimated Daily Trips | Fare Volatility |
|---|---|---|---|---|
| Mumbai | ₹285 | ₹28.50 | 82,000 | 12.4% |
| Delhi | ₹310 | ₹25.83 | 94,000 | 15.8% |
| Bengaluru | ₹245 | ₹30.63 | 71,000 | 9.7% |
| Hyderabad | ₹335 | ₹27.92 | 63,000 | 18.2% |
This allows analysts to consider pricing alongside market activity rather than treating fare as an isolated number.
For investors and strategy teams, combining pricing observations with market-size estimates, trip volumes, platform presence, and city expansion can support structured transportation-market research.
Integrating Car Rental and Mobility Data
Ride-hailing does not operate independently from other mobility services. Consumers may compare taxis, ride-hailing, car rentals, public transportation, airport transfers, and other alternatives.
Car Rental Data Scraping can therefore complement ride-hailing datasets by capturing rental rates, vehicle categories, rental duration, availability, mileage policies, and location-specific pricing.
For longer journeys, businesses can compare the economics of booking multiple ride-hailing trips against renting a vehicle for a day or several days.
This creates a broader mobility Ride-Hailing Intelligence framework rather than a narrow ride-hailing pricing database.
Applications of Ride-Hailing Fare Data
Competitive Intelligence
Mobility companies can benchmark competitors' pricing structures and identify recurring changes in fare levels.
Market Research
Consulting and research teams can use historical fare observations to study transportation pricing across markets.
Investment Research
Analysts can incorporate pricing trends into broader assessments of mobility platforms, while recognizing that fare data alone does not represent profitability or market valuation.
Consumer Pricing Analysis
Businesses can identify how effective customer prices vary by route, distance, time, and vehicle category.
Geographic Expansion Research
Companies entering new markets can compare pricing structures across cities before developing localized strategies.
Dynamic Pricing Research
Repeated observations can help researchers study how fares respond to time, demand conditions, and local market characteristics.
Data Quality and Standardization
Fare comparisons require consistent collection methodology. Comparing a five-kilometer economy ride during an off-peak period with a ten-kilometer premium ride during peak demand can produce misleading conclusions.
A structured collection framework should therefore standardize:
- Distance
- Vehicle category
- Pickup location
- Drop-off location
- Collection timestamp
- Currency
- Fare components
- Estimated duration
- Surge status
- Platform
- City
Historical records should retain timestamps because current prices cannot necessarily be assumed to represent earlier periods.
Extract ride-hailing fare per trip by city data to identify missing fares, abnormal values, duplicate observations, route changes, and inconsistent currency formats.
How Travel Scrape Can Help You?
Automated Fare Collection
Travel Scrape can collect structured ride-hailing fare observations across defined routes, cities, vehicle categories, and time intervals, creating datasets suitable for recurring benchmarking and analysis.
Comparative Pricing Data
Its data workflows can organize fare-per-trip and fare-per-kilometer observations across platforms, enabling businesses to compare standardized journeys and identify pricing differences systematically.
City-Level Intelligence
Travel Scrape can structure location-specific mobility data by city, route, vehicle type, and collection time, helping research teams evaluate geographical pricing variations consistently.
Historical Monitoring
Repeated data collection can create historical pricing records that support trend analysis, volatility measurement, peak-period comparisons, and identification of meaningful changes across monitored transportation markets.
Customized Mobility Datasets
Travel Scrape can deliver tailored datasets containing fares, distances, durations, vehicle categories, timestamps, and related fields according to specific research, benchmarking, or business intelligence requirements.
Conclusion
Fare-per-trip and fare-per-kilometer metrics provide complementary perspectives on ride-hailing economics. Total fare reveals the customer's immediate cost, while fare per kilometer creates a normalized framework for comparing journeys with different distances.
When these metrics are collected repeatedly across cities, routes, vehicle categories, and time periods, they can support detailed pricing benchmarks, competitive research, market analysis, and mobility intelligence.
The addition of trip volume, surge observations, duration, availability, and geographic information can further strengthen the analytical value of the dataset. Integrating ride-hailing observations with Car Rental Data Intelligence can also provide a wider perspective on consumer mobility choices and transportation pricing.
A well-structured scraping and data-processing workflow ultimately turns individual fare observations into a historical mobility intelligence asset that can support research, benchmarking, and data-driven transportation analysis.
Ready to elevate your travel business with cutting-edge data insights? Scrape Aggregated Flight Fares to identify competitive rates and optimize your revenue strategies efficiently. Discover emerging opportunities with tools to Extract Travel Website Data, leveraging comprehensive data to forecast market shifts and enhance your service offerings. Real-Time Travel App Data Scraping Services helps stay ahead of competitors, gaining instant insights into bookings, promotions, and customer behavior across multiple platforms. Get in touch with Travel Scrape today to explore how our end-to-end data solutions can uncover new revenue streams, enhance your offerings, and strengthen your competitive edge in the travel market.
Unlock the Full Report
Enter your details to access premium pricing intelligence insights