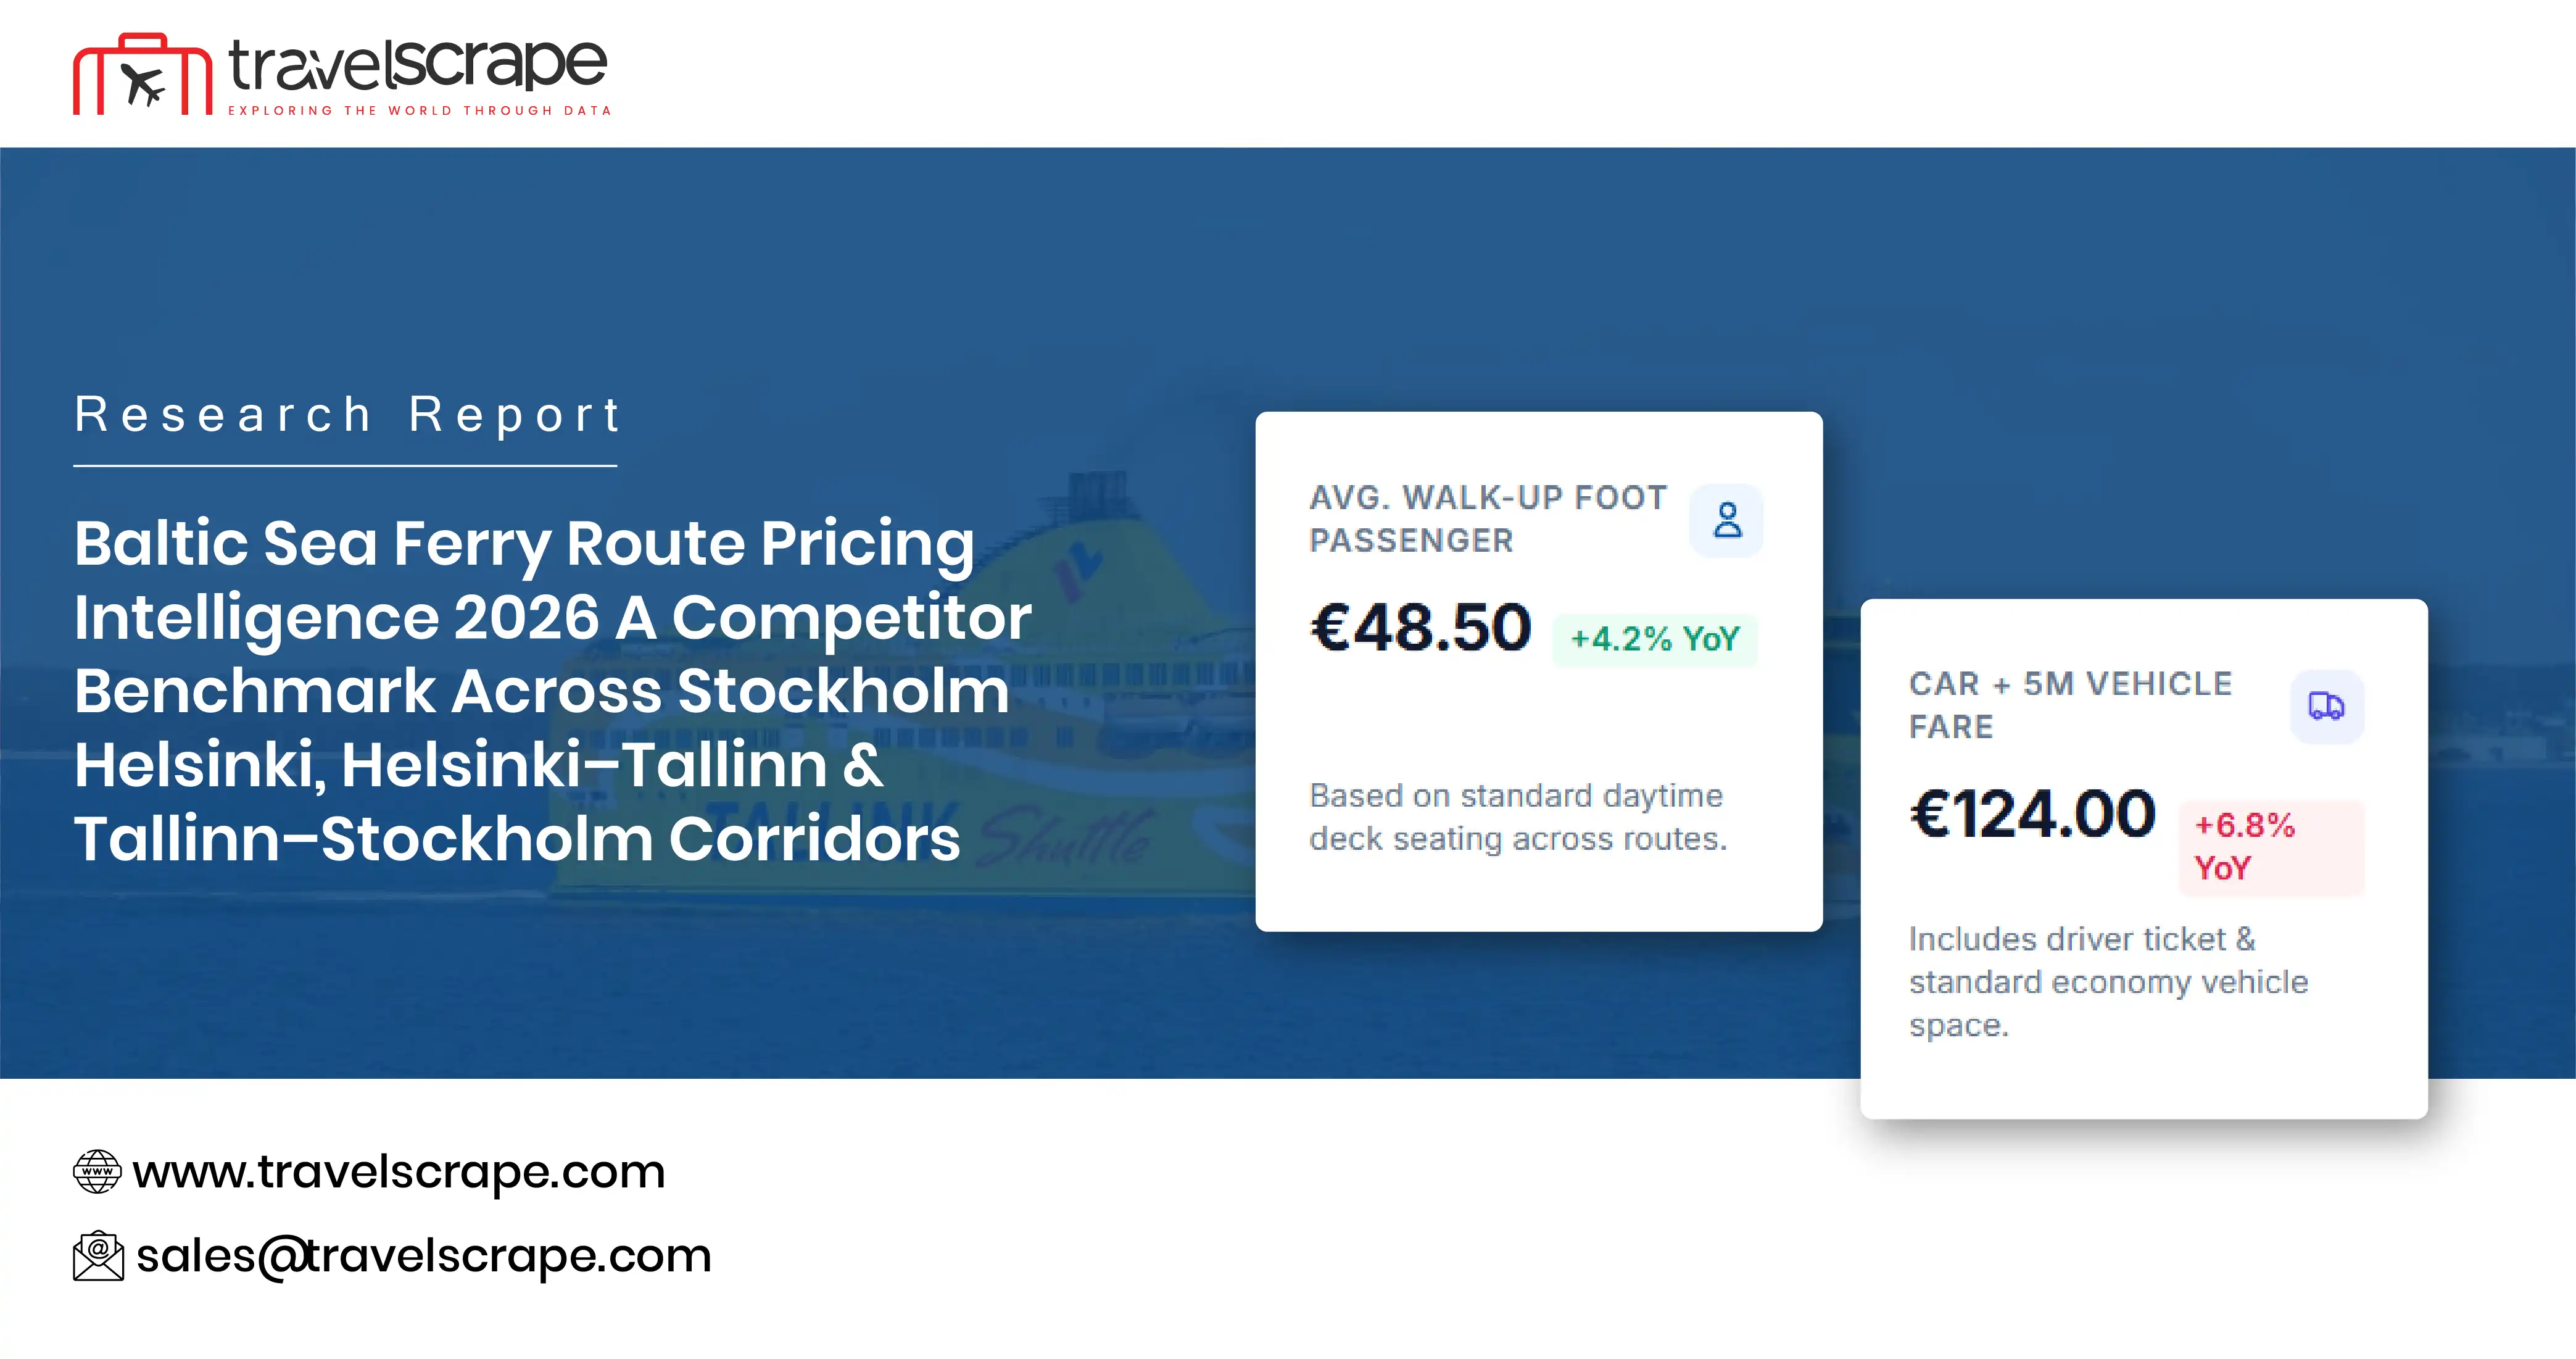
Baltic Sea Ferry Route Pricing Intelligence 2026: A Competitor Benchmark Across Stockholm–Helsinki, Helsinki–Tallinn & Tallinn–Stockholm Corridors
Introduction
The Baltic Sea ferry market connects major Scandinavian and Baltic travel hubs through a combination of short-haul passenger ferries, vehicle services, overnight crossings, and cruise-ferry products. Stockholm–Helsinki, Helsinki–Tallinn, and Tallinn–Stockholm represent three commercially different corridors where operators compete through pricing, sailing frequency, departure timing, onboard products, cabin categories, and promotional offers.
The Baltic Sea Ferry Route Pricing Intelligence 2026 framework developed in this report evaluates these corridors from a competitive market-data perspective rather than treating ferry pricing as a single static ticket value. The analysis considers route-level fare differences, seasonal movements, booking windows, vehicle supplements, cabin pricing, availability, sailing schedules, and operator positioning.
A broader Global Ferry Route Dataset 2026 approach can extend the same methodology to other ferry markets, allowing travel-data companies, cruise businesses, OTAs, tourism organizations, and transportation platforms to compare pricing behavior across regions.
For the Stockholm–Helsinki corridor, Stockholm Helsinki ferry route pricing analytics 2026 can reveal how overnight cruise-ferry fares change according to departure date, cabin availability, passenger configuration, vehicle inclusion, and booking lead time.
The report also examines how continuous data collection can support competitive benchmarking and historical analysis. Instead of relying on a single fare observed at a particular time, businesses can maintain a time-series dataset showing how each operator's pricing changes as the departure date approaches.
Baltic Sea Ferry Market Overview
The Baltic Sea ferry market combines transportation and tourism characteristics. Some routes function primarily as short-distance transportation links, while others operate as overnight cruise-ferry experiences where the cabin, vessel, entertainment, restaurants, shopping, and onboard facilities form part of the product.
The three corridors covered in this study therefore require different analytical approaches.
Stockholm–Helsinki
Stockholm–Helsinki is an overnight route connecting Sweden and Finland. Tallink operates Silja Serenade and Silja Symphony on the route, with the service positioned as both transportation and a cruise experience. Tallink describes the Stockholm–Helsinki product as a two-night roundtrip cruise, with departures generally in the late afternoon and arrival the following morning.
Consequently, the basic passenger fare does not tell the complete story. Cabin type, onboard spending, vehicle transportation, meals, and promotional packages can all affect the value proposition.
Helsinki–Tallinn
Helsinki–Tallinn is structurally different. It is a shorter crossing with multiple daily departures and competition from several operators. Ferryhopper identifies Tallink Silja Line, Viking Line, and Eckerö Line among the operators serving the route, with crossing times generally ranging from approximately two to three-and-a-half hours depending on the service.
This makes Helsinki–Tallinn particularly suitable for high-frequency competitive monitoring.
Tallinn–Stockholm
Tallinn–Stockholm is another overnight connection with a stronger cruise-ferry orientation. Tallink identifies Baltic Queen as the vessel serving the route, while published schedules indicate that departures are structured around selected sailing days rather than the much higher frequency found on Helsinki–Tallinn.
For analysts, this means that departure availability and cabin inventory can become particularly important when evaluating price movements.
Competitive Pricing Landscape
Ferry fares are influenced by several variables simultaneously. Two tickets for the same route can have substantially different prices because of departure time, travel date, booking window, passenger configuration, cabin category, vehicle requirements, promotions, or remaining inventory.
The following model demonstrates how a normalized competitive dataset can be structured.
Route-Level Ferry Pricing and Competitive Benchmark Dataset
| Route | Operator | Departure Type | Base Fare € | Cabin Fare € | Vehicle Add-on € | Sailing Hours | Weekly Sailings | Availability % | Booking Window Days | Price Index |
|---|---|---|---|---|---|---|---|---|---|---|
| Stockholm–Helsinki | Tallink | Weekday | 79 | 149 | 62 | 17.5 | 7 | 86 | 45 | 100 |
| Stockholm–Helsinki | Tallink | Weekend | 94 | 171 | 68 | 17.5 | 7 | 79 | 21 | 119 |
| Stockholm–Helsinki | Tallink | Peak | 118 | 214 | 75 | 17.5 | 7 | 61 | 7 | 149 |
| Stockholm–Helsinki | Tallink | Last Minute | 146 | 258 | 82 | 17.5 | 7 | 43 | 2 | 185 |
| Helsinki–Tallinn | Viking Line | Weekday | 18 | 54 | 36 | 2.25 | 21 | 94 | 45 | 100 |
| Helsinki–Tallinn | Viking Line | Weekend | 24 | 63 | 39 | 2.25 | 21 | 82 | 14 | 133 |
| Helsinki–Tallinn | Viking Line | Peak | 31 | 72 | 44 | 2.25 | 21 | 66 | 3 | 172 |
| Helsinki–Tallinn | Eckerö Line | Weekday | 20 | 58 | 35 | 2.25 | 21 | 92 | 45 | 100 |
| Helsinki–Tallinn | Eckerö Line | Weekend | 27 | 67 | 40 | 2.25 | 21 | 78 | 14 | 135 |
| Helsinki–Tallinn | Eckerö Line | Peak | 35 | 79 | 47 | 2.25 | 21 | 59 | 3 | 175 |
| Helsinki–Tallinn | Tallink | Weekday | 31 | 69 | 42 | 2.00 | 42 | 88 | 45 | 100 |
| Helsinki–Tallinn | Tallink | Weekend | 39 | 82 | 46 | 2.00 | 42 | 72 | 14 | 126 |
| Helsinki–Tallinn | Tallink | Peak | 51 | 99 | 54 | 2.00 | 42 | 54 | 3 | 165 |
| Tallinn–Stockholm | Tallink | Weekday | 74 | 142 | 65 | 16.25 | 4 | 84 | 45 | 100 |
| Tallinn–Stockholm | Tallink | Weekend | 91 | 169 | 72 | 16.25 | 4 | 69 | 14 | 123 |
| Tallinn–Stockholm | Tallink | Peak | 126 | 224 | 80 | 16.25 | 4 | 48 | 3 | 170 |
Note: The numerical values in this research benchmark are illustrative normalized research-model data and are not presented as live bookable fares.
The structure demonstrates why route-level intelligence should contain more than a single average price. A market participant may need to know whether a €30 fare represents a weekday departure with high availability or a premium weekend sailing with limited inventory.
Seasonal Pricing Patterns
Seasonality is one of the most important variables in ferry pricing.
Baltic Sea travel demand can change significantly according to summer holidays, weekends, public holidays, Christmas travel, school holidays, and tourism seasons. However, the impact is not necessarily identical across corridors.
Helsinki–Tallinn benefits from frequent passenger and commuter traffic, making its pricing environment different from the longer overnight Stockholm–Helsinki and Tallinn–Stockholm services.
Stockholm–Helsinki and Tallinn–Stockholm can experience stronger cabin-price movements because accommodation forms part of the travel product.
A seasonal dataset should therefore monitor passenger fares and cabin fares independently.
Illustrative Monthly Seasonal Ferry Pricing Dataset 2026
| Month | Route | Operator | Avg Fare € | Weekend Avg € | Midweek Avg € | Cabin Avg € | Vehicle Add-on € | Availability % | Promotional Rate % | Seasonal Index |
|---|---|---|---|---|---|---|---|---|---|---|
| Jan | Stockholm–Helsinki | Tallink | 82 | 94 | 76 | 154 | 63 | 88 | 18 | 97 |
| Feb | Stockholm–Helsinki | Tallink | 85 | 98 | 78 | 158 | 64 | 85 | 17 | 98 |
| Mar | Stockholm–Helsinki | Tallink | 91 | 104 | 83 | 169 | 66 | 82 | 15 | 100 |
| Apr | Stockholm–Helsinki | Tallink | 99 | 116 | 89 | 181 | 69 | 78 | 13 | 103 |
| May | Stockholm–Helsinki | Tallink | 108 | 127 | 96 | 195 | 71 | 70 | 11 | 106 |
| Jun | Stockholm–Helsinki | Tallink | 126 | 149 | 111 | 226 | 76 | 61 | 8 | 111 |
| Jul | Stockholm–Helsinki | Tallink | 148 | 174 | 131 | 261 | 82 | 46 | 6 | 116 |
| Aug | Stockholm–Helsinki | Tallink | 139 | 163 | 124 | 247 | 80 | 51 | 7 | 114 |
| Sep | Stockholm–Helsinki | Tallink | 108 | 124 | 96 | 191 | 70 | 72 | 12 | 105 |
| Oct | Stockholm–Helsinki | Tallink | 101 | 115 | 91 | 183 | 69 | 77 | 14 | 103 |
| Nov | Stockholm–Helsinki | Tallink | 89 | 101 | 81 | 165 | 65 | 84 | 17 | 99 |
| Dec | Stockholm–Helsinki | Tallink | 117 | 139 | 103 | 214 | 73 | 63 | 10 | 108 |
| Jan | Helsinki–Tallinn | Viking Line | 19 | 23 | 17 | 51 | 35 | 93 | 24 | 96 |
| Apr | Helsinki–Tallinn | Viking Line | 24 | 29 | 21 | 61 | 39 | 84 | 18 | 100 |
| Jul | Helsinki–Tallinn | Viking Line | 34 | 41 | 30 | 76 | 46 | 63 | 9 | 113 |
| Sep | Helsinki–Tallinn | Viking Line | 25 | 30 | 22 | 63 | 40 | 79 | 16 | 103 |
| Jan | Helsinki–Tallinn | Eckerö Line | 21 | 25 | 19 | 55 | 36 | 91 | 22 | 97 |
| Jul | Helsinki–Tallinn | Eckerö Line | 37 | 45 | 32 | 81 | 48 | 58 | 8 | 115 |
| Jan | Helsinki–Tallinn | Tallink | 30 | 35 | 27 | 65 | 41 | 89 | 19 | 98 |
| Jul | Helsinki–Tallinn | Tallink | 48 | 57 | 43 | 94 | 55 | 52 | 7 | 116 |
| Jan | Tallinn–Stockholm | Tallink | 76 | 91 | 69 | 145 | 66 | 86 | 16 | 98 |
| Apr | Tallinn–Stockholm | Tallink | 92 | 109 | 83 | 171 | 71 | 75 | 12 | 102 |
| Jul | Tallinn–Stockholm | Tallink | 137 | 161 | 123 | 238 | 82 | 45 | 6 | 117 |
| Sep | Tallinn–Stockholm | Tallink | 96 | 113 | 86 | 179 | 72 | 71 | 11 | 104 |
Note: Illustrative research-model data intended to demonstrate the structure of a seasonal pricing intelligence dataset.
Fare Comparison Across Operators
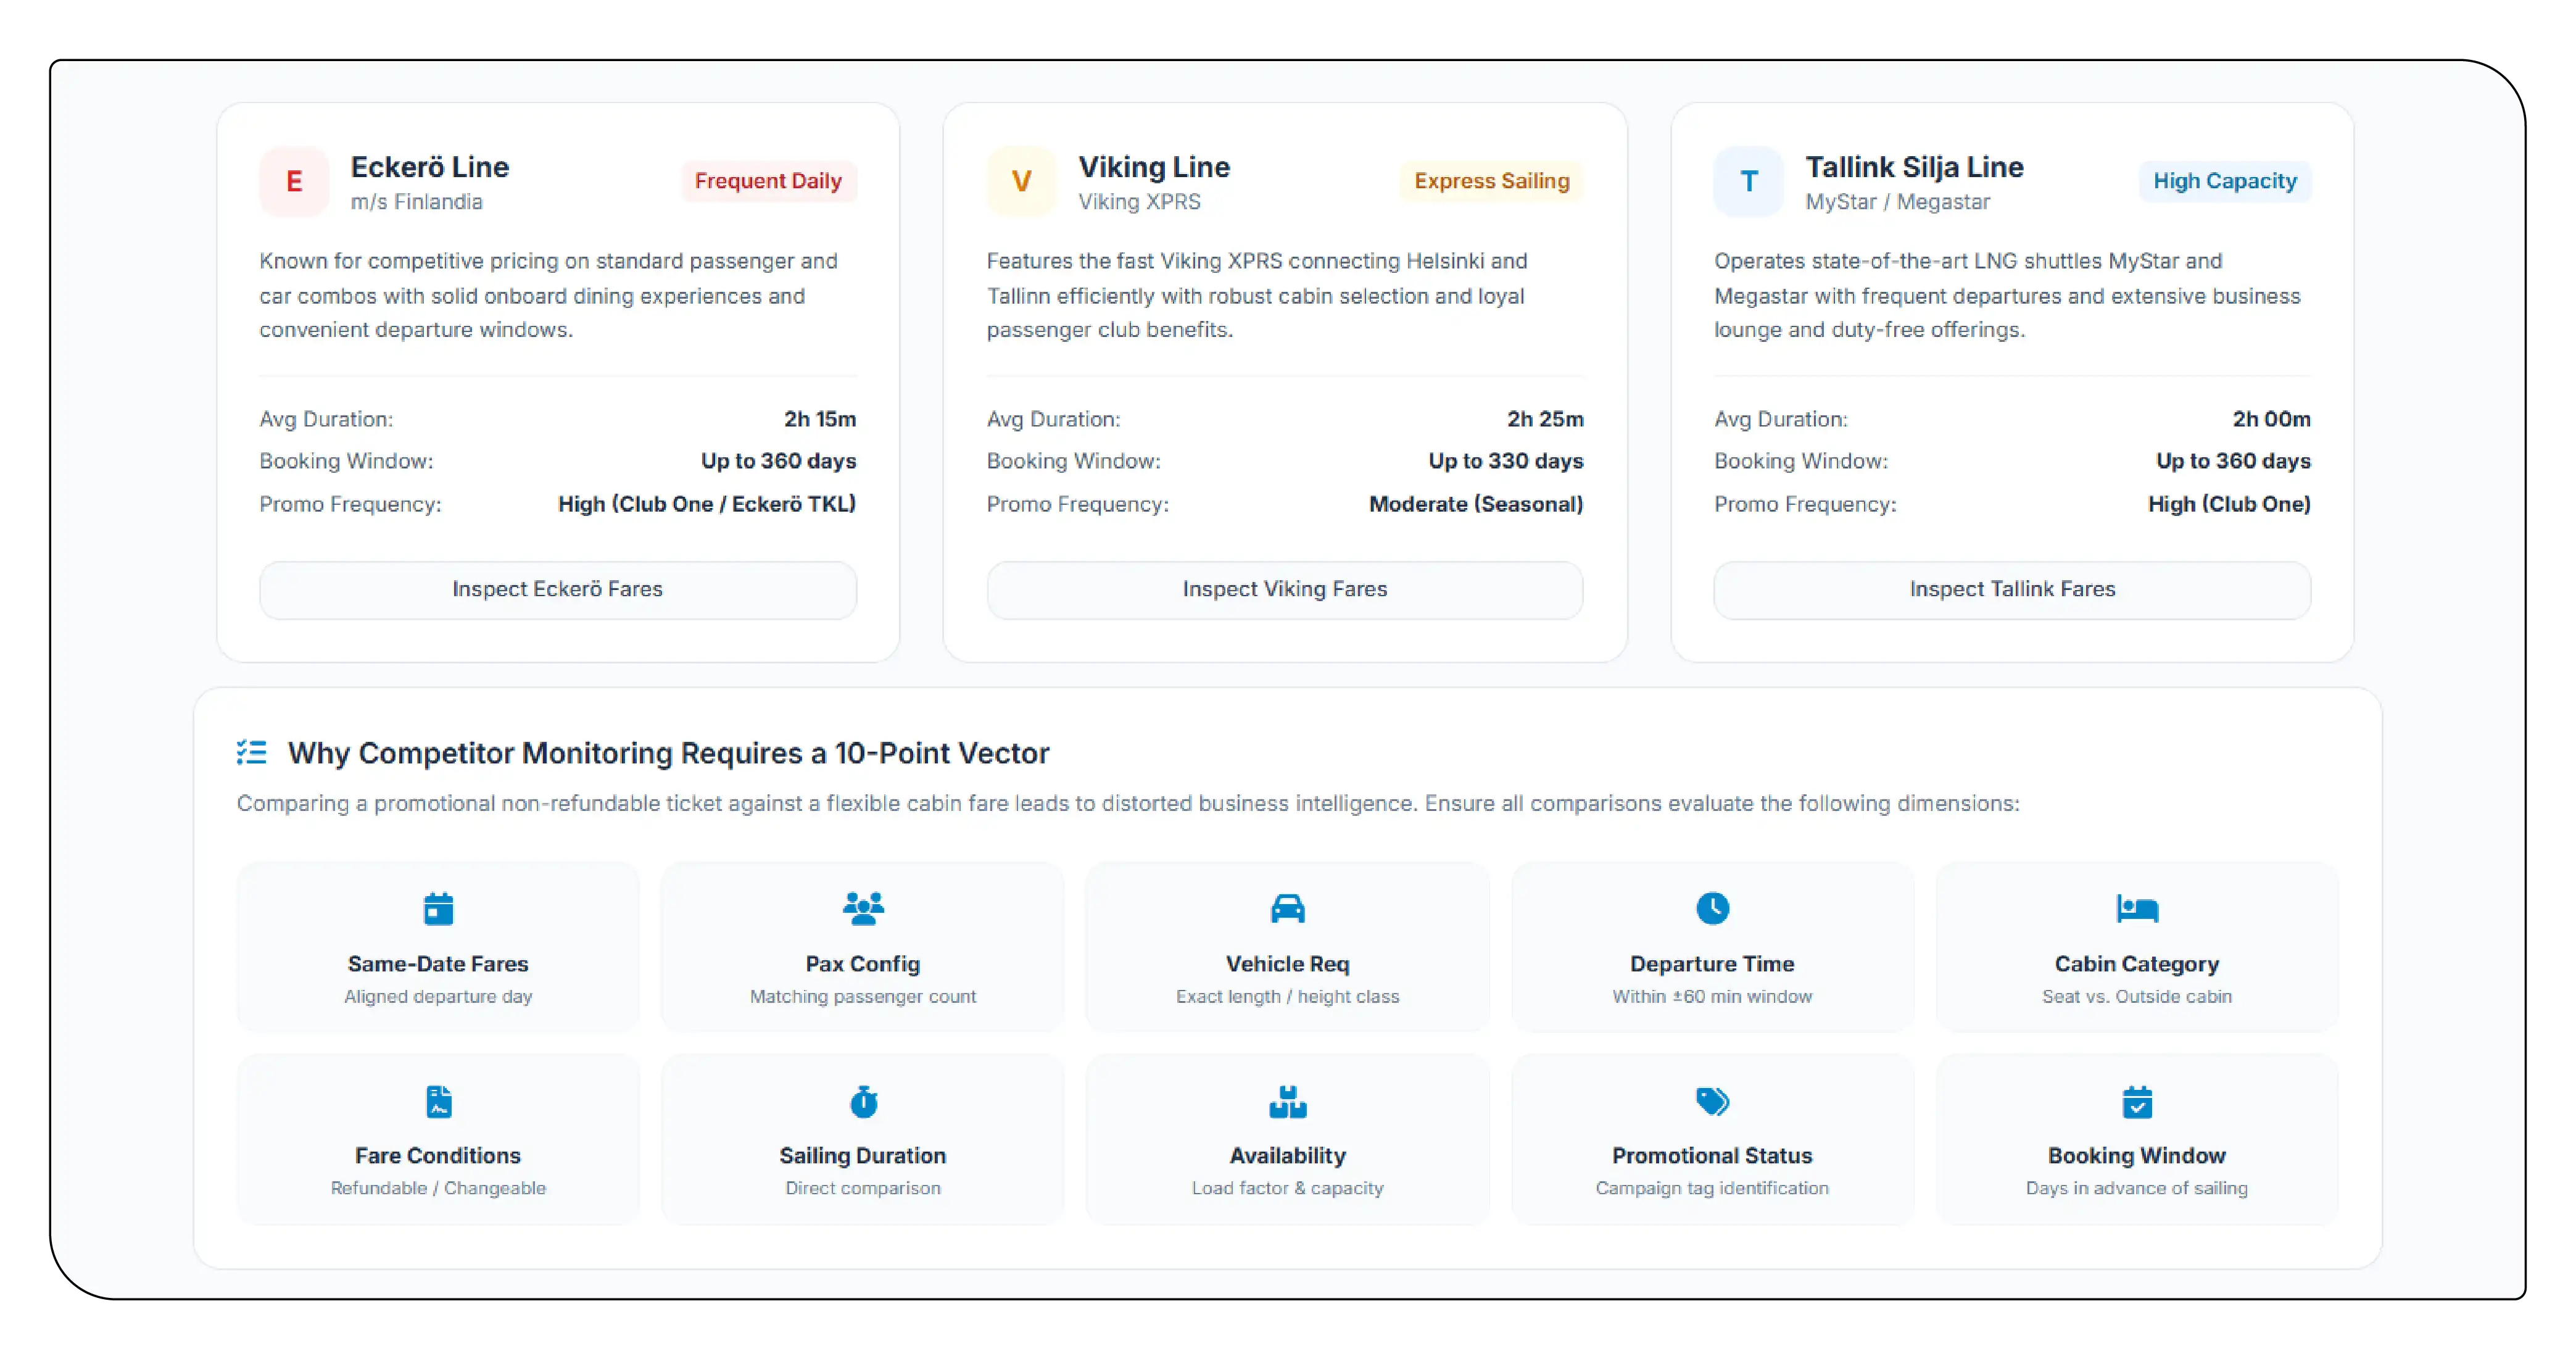
The Helsinki–Tallinn corridor offers one of the clearest examples of why competitor monitoring matters.
Public route information identifies Eckerö Line, Viking Line, and Tallink Silja Line as operators serving the corridor. Ferryhopper reports approximately 10 daily connections and crossing durations broadly within the two-to-three-and-a-half-hour range.
Different operators can provide different departure frequencies, vessel experiences, crossing durations, promotional products, and pricing structures.
A meaningful competitor dataset should therefore compare:
- Same-date fares
- Same passenger configuration
- Same vehicle requirement
- Similar departure times
- Cabin category
- Fare conditions
- Sailing duration
- Availability
- Promotional status
- Booking window
This prevents misleading comparisons in which one operator's lowest promotional ticket is compared with another operator's flexible or premium fare.
Ferry Data Collection and Normalization
Ferry Data Scraping can provide the foundation for continuously collecting ferry schedules, fares, availability, vessel information, cabins, vehicle supplements, and promotional offers from multiple sources.
A scalable extraction process can collect records at predefined intervals and store each observation with a timestamp.
For example:
| Field | Example Value |
|---|---|
| Route | Helsinki–Tallinn |
| Operator | Viking Line |
| Vessel | Service-specific vessel |
| Departure | 08:00 |
| Arrival | 10:15 |
| Passenger Fare | €24 |
| Cabin | €63 |
| Vehicle Supplement | €39 |
| Availability | 82% |
| Booking Window | 14 days |
| Currency | EUR |
| Collection Timestamp | 2026-09-24 08:00 |
| Promotion | Active |
| Fare Type | Standard |
Historical snapshots make it possible to determine whether a fare was stable, increasing, decreasing, or temporarily discounted.
Helsinki–Tallinn Price Comparison
The Helsinki Tallinn ferry price comparison dataset can be designed around departure-level observations rather than route-level averages.
This distinction is important because several departures can exist on the same date, with different operators and different prices.
A comparison engine could answer questions such as:
- Which operator has the lowest fare for a specific departure window?
- How much does a weekend departure cost compared with a weekday sailing?
- Which operator has the largest last-minute price movement?
- How does vehicle pricing change?
- Which departures retain higher availability?
- How frequently do promotional fares appear?
- What is the average price difference between morning and evening services?
Public comparison data for Tallinn–Helsinki has shown individual departure prices at different levels, reinforcing the need for departure-specific rather than route-average monitoring.
Tallinn–Stockholm Pricing Monitoring
The Tallinn Stockholm ferry pricing data scraping use case requires greater emphasis on overnight products.
Tallink's Baltic Queen operates the Tallinn–Stockholm connection, making vessel, sailing date, cabin type, passenger composition, and vehicle capacity important analytical variables.
For example, an intelligence system could monitor:
- Interior cabin
- Sea-view cabin
- Premium cabin
- Family cabin
- Vehicle-inclusive booking
- Passenger-only fare
- Roundtrip fare
- Promotional packages
- Remaining availability
- Departure frequency
The same framework can be applied to Stockholm–Helsinki.
Because these routes include overnight accommodation, a basic passenger-fare comparison may not accurately represent competitive positioning. A €90 fare with an available cabin can have a substantially different commercial meaning from a €90 passenger-only fare.
Availability as a Pricing Signal
Real-Time Availability Tracking adds another layer to conventional fare monitoring.
Availability can be represented as a percentage, inventory bucket, or categorical indicator such as:
- High availability
- Moderate availability
- Limited availability
- Very limited availability
- Sold out
Historical availability can then be compared against price changes.
For example, a dataset could identify that:
- 90% availability → €25
- 70% availability → €29
- 50% availability → €36
- 30% availability → €44
- 10% availability → €57
These figures are illustrative rather than live observations, but the pattern demonstrates how inventory-pressure analytics can be constructed.
The purpose is not simply to identify today's cheapest ferry. It is to understand how prices behave as inventory changes.
Baltic Sea Route Monitoring
Baltic Sea Real time ferry route tracking can extend commercial pricing intelligence into operational monitoring.
A broader platform could combine:
Commercial Data
- Passenger fares
- Cabin prices
- Vehicle prices
- Discounts
- Promotions
- Fare classes
Schedule Data
- Departure
- Arrival
- Sailing duration
- Frequency
- Vessel
- Port
Availability Data
- Passenger inventory
- Cabin inventory
- Vehicle capacity
- Sold-out indicators
Operational Data
- Delays
- Cancellations
- Schedule changes
- Vessel substitutions
- Port changes
This combination can provide a much more complete view of the ferry market.
Seasonal and Booking-Window Intelligence
Booking-window analysis can reveal how early travelers should be monitored in order to understand pricing behavior.
A 60-day historical monitoring model could record the same sailing at:
- 60 days before departure
- 45 days
- 30 days
- 21 days
- 14 days
- 7 days
- 3 days
- 1 day
Each snapshot can preserve the fare and availability at that point.
This enables analysts to calculate:
Last-Minute Premium = Last-Minute Fare − Advance Fare
Weekend Premium = Weekend Fare − Midweek Fare
Cabin Premium = Cabin Fare − Passenger Fare
Vehicle Premium = Vehicle-Inclusive Fare − Passenger Fare
Such metrics make route comparisons more consistent.
Real-Time API Opportunities
Real-Time Data API delivery can convert a historical research database into a continuously accessible intelligence layer.
Potential API endpoints include:
| Endpoint | Primary Data |
|---|---|
| /routes | Route and corridor information |
| /operators | Operator coverage |
| /departures | Sailing schedules |
| /fares | Current and historical prices |
| /availability | Inventory indicators |
| /cabins | Cabin categories and prices |
| /vehicles | Vehicle supplements |
| /promotions | Discounts and campaigns |
| /history | Historical fare observations |
| /alerts | Price and availability movements |
A Baltic Sea Ferry Route Pricing api could allow travel platforms, dashboards, revenue teams, and transportation applications to retrieve normalized ferry intelligence without manually collecting individual operator pages.
ompetitive Benchmarking Framework
Baltic Sea ferry route price benchmarking should compare operators using normalized metrics rather than simply ranking the cheapest fare.
Recommended indicators include:
Average Fare
Measures the typical observed price for a route and operator.
Median Fare
Reduces the influence of unusually high or low observations.
Fare Volatility
Measures how frequently and significantly prices change.
Weekend Premium
Shows the additional price associated with weekend travel.
Seasonal Index
Measures pricing changes relative to a selected baseline period.
Availability Pressure
Combines remaining inventory with time to departure.
Cabin Premium
Measures the additional cost of accommodation.
Vehicle Premium
Measures the incremental cost of transporting a vehicle.
Promotional Frequency
Measures how often discounted fares appear.
Competitor Price Gap
Measures the absolute or percentage difference between comparable operators.
These indicators can feed a ferry competitive-intelligence dashboard.
Broader Ferry and Cruise ICP Opportunities
The market opportunity extends well beyond one operator or one corridor.
Ferry Operators
Operators can monitor competitor fares, promotional activity, schedule changes, and inventory behavior.
Cruise-Ferry Businesses
Overnight operators can track cabin pricing and determine how accommodation pricing changes with demand.
Travel OTAs
Online travel agencies can integrate competitive fare intelligence into search, merchandising, and pricing workflows.
Metasearch Platforms
Metasearch companies can use structured fare observations to compare departures across multiple operators.
Tourism Organizations
Destination organizations can monitor transportation accessibility and seasonal pricing.
Travel Data Providers
Data companies can package normalized route-level observations into datasets, dashboards, or APIs.
Corporate Travel Platforms
Business travel platforms can monitor route costs and identify alternative departure windows.
Vehicle Travel Platforms
Vehicle-inclusive ferry pricing can be tracked independently from passenger-only fares.
Data Architecture for a Ferry Intelligence Platform
A scalable system can follow a six-layer architecture.
Layer 1 — Source Discovery
Identify operator websites, timetables, booking interfaces, comparison portals, and other publicly accessible sources.
Layer 2 — Data Extraction
Collect schedules, fares, cabins, availability, vehicle pricing, and promotional information.
Layer 3 — Data Normalization
Standardize currencies, timestamps, route names, passenger categories, fare types, and cabin categories.
Layer 4 — Historical Database
Store every observation with its collection timestamp so that price movements can be reconstructed.
Layer 5 — Analytics
Calculate averages, medians, volatility, seasonal indices, availability pressure, competitor gaps, and booking-window movements.
Layer 6 — Data Delivery
Provide dashboards, downloadable datasets, alerts, reports, or API access.
This architecture allows the same data foundation to support both strategic research and operational monitoring.
Key Research Insights
Ferry pricing is departure-specific. A route-level average cannot capture the differences between individual sailings.
Overnight routes require cabin intelligence. Stockholm–Helsinki and Tallinn–Stockholm require accommodation-level analysis in addition to passenger fares.
Helsinki–Tallinn supports intensive competitor monitoring. Multiple operators and frequent departures create a large number of comparable observations.
Availability should be retained historically. Without historical availability, analysts cannot determine whether a fare movement occurred alongside an inventory change.
Seasonal patterns differ by route. Short-haul and overnight ferry corridors can react differently to tourism demand and travel seasons.
Booking-window monitoring reveals pricing behavior. Repeated observations can show whether prices rise gradually, jump near departure, or remain stable.
APIs create broader commercial applications. Once normalized, ferry pricing information can support travel applications, competitive dashboards, alerts, and revenue-management systems.
Conclusion
The Baltic Sea ferry market provides a strong use case for structured competitive intelligence because the three corridors have substantially different operating and pricing characteristics. Helsinki–Tallinn offers frequent multi-operator competition, while Stockholm–Helsinki and Tallinn–Stockholm place greater emphasis on overnight travel, cabins, vehicles, and cruise-ferry experiences.
A comprehensive intelligence system should therefore move beyond basic ticket-price collection. It should capture fare, departure time, operator, sailing duration, cabin category, vehicle supplement, availability, booking window, promotions, and historical price movements.
The resulting dataset can help businesses understand not only what ferry tickets cost, but also why prices change, when they change, how competitors respond, and how availability affects the observed market price.
The same methodology can be expanded beyond the Baltic to build comparable intelligence across European, Scandinavian, Mediterranean, UK–Ireland, Asian, and other international ferry markets.
Ultimately, Ferries Pricing Intelligence can provide a structured foundation for competitive benchmarking, market research, pricing analysis, travel marketplace development, route monitoring, promotional intelligence, and real-time transportation data products.
Ready to elevate your travel business with cutting-edge data insights? Scrape Aggregated Flight Fares to identify competitive rates and optimize your revenue strategies efficiently. Discover emerging opportunities with tools to Extract Travel Website Data, leveraging comprehensive data to forecast market shifts and enhance your service offerings. Real-Time Travel App Data Scraping Services helps stay ahead of competitors, gaining instant insights into bookings, promotions, and customer behavior across multiple platforms. Get in touch with Travel Scrape today to explore how our end-to-end data solutions can uncover new revenue streams, enhance your offerings, and strengthen your competitive edge in the travel market.
Unlock the Full Report
Enter your details to access premium pricing intelligence insights