State of US Airfare Price Volatility 2026: How Often Fares Drop After Booking
Introduction
The U.S. airline market entered 2026 with a pricing environment shaped by strong passenger demand, constrained capacity, aircraft-delivery delays, labor expenses, competitive changes, and unusually volatile fuel costs. US Airfare Price Volatility 2026 has therefore become an important intelligence theme for airlines, travel agencies, corporate travel managers, online travel platforms, investors, and data-driven fare optimization companies.
The latest U.S. Bureau of Transportation Statistics data provides an important baseline. Average U.S. domestic airfare increased to $428 in Q1 2026, up 4.7% from the inflation-adjusted $409 recorded in Q4 2025. BTS also expanded its ticket sampling methodology beginning July 2025, moving from a 10% sample to a 40% sample of scheduled U.S. air-carrier tickets, improving the breadth of the underlying fare dataset.
A broader Global Flight Price Trends Dataset can place these U.S. movements into international context by comparing routes, booking windows, airlines, currencies, fuel conditions, seasonal demand, and airport-level pricing behavior.
At the operational level, Airfare Price Drop Tracking US allows businesses to identify when previously expensive routes experience meaningful fare reductions. Such intelligence is increasingly valuable because airfare can move rapidly in response to inventory changes, competitor actions, demand shocks, and fuel-market developments.
The 2026 market is particularly notable because airfare increases have occurred alongside persistent travel demand. Recent reporting indicates U.S. domestic airfares were substantially higher year over year during the summer, while elevated jet-fuel costs, limited capacity, and strong demand continued to support higher ticket prices.
Understanding the 2026 Volatility Environment
Airfare volatility is not simply the percentage change in the average ticket price. It represents the frequency, magnitude, direction, and duration of price movements across individual routes and booking periods.
A flight from New York to Los Angeles can have dozens of fare observations before departure. Prices may decline after weak demand, rise when a fare bucket sells out, change after competitors modify schedules, or jump sharply as departure approaches. Consequently, a monthly average can conceal substantial intraday and route-level volatility.
Several structural factors are particularly important in 2026. BCG forecasts global air travel to grow approximately 5.8% during 2026 after 6% growth in 2025, while airline costs continue to face pressure from labor and inflation.
Fuel has become another major volatility driver. Reporting in August 2026 indicated that jet fuel prices had risen sharply during the year amid geopolitical disruption and constrained refining capacity. Fuel can represent roughly 30–35% of airline operating costs, making sudden energy-price movements highly relevant to fare strategies.
Illustrative U.S. Airfare Volatility Dataset, 2026
| Route / Market | Typical Fare Baseline ($) | Q1 2026 Indicator | Estimated Peak Fare ($) | Estimated Low Fare ($) | Peak-to-Low Spread ($) | Volatility Range (%) | Typical Booking Window | Demand Profile | Competitive Intensity | Primary Volatility Driver |
|---|---|---|---|---|---|---|---|---|---|---|
| New York–Los Angeles | 410 | 428 | 690 | 285 | 405 | 95.0 | 21–45 days | High | High | Demand + capacity |
| Los Angeles–Chicago | 395 | 417 | 645 | 260 | 385 | 97.5 | 18–42 days | High | High | Capacity + seasonality |
| New York–Miami | 365 | 389 | 610 | 235 | 375 | 102.7 | 14–40 days | Very High | High | Leisure demand |
| Dallas–Los Angeles | 315 | 329 | 525 | 205 | 320 | 101.6 | 14–35 days | High | Very High | Low-cost competition |
| Atlanta–Orlando | 245 | 258 | 430 | 145 | 285 | 116.3 | 10–30 days | Very High | High | Leisure seasonality |
| Chicago–Las Vegas | 280 | 294 | 490 | 165 | 325 | 116.1 | 12–35 days | Very High | High | Weekend demand |
| Boston–Chicago | 330 | 344 | 540 | 215 | 325 | 98.5 | 18–45 days | High | Medium | Business demand |
| Seattle–San Francisco | 285 | 301 | 470 | 185 | 270 | 100.0 | 14–35 days | High | High | Business + capacity |
| Denver–Phoenix | 255 | 268 | 420 | 150 | 270 | 105.9 | 12–30 days | High | High | Seasonal demand |
| Miami–Atlanta | 300 | 315 | 510 | 180 | 330 | 110.0 | 14–35 days | High | Medium | Demand + fuel |
| San Francisco–New York | 455 | 478 | 745 | 320 | 425 | 93.4 | 25–50 days | High | Medium | Long-haul capacity |
| Washington–Chicago | 325 | 341 | 515 | 220 | 295 | 90.8 | 21–45 days | Very High | Medium | Business travel |
The route-level figures above are an analytical modeling framework rather than official BTS route observations. They demonstrate how a commercial airfare volatility dataset can be structured. Official BTS fare statistics should be used when reporting measured market averages.
BTS's official airport-level 2025 dataset illustrates why geographic segmentation matters. For example, the 2025 average fare was approximately $453 at San Francisco International Airport, $469 at Washington Dulles, $446 at Charlotte, and $275 at Fort Lauderdale, demonstrating substantial differences between U.S. markets.
How Fare Fluctuation Is Measured?
A robust US flight price fluctuation data scraping program should capture repeated observations instead of collecting fares only once. Each observation can contain airline, origin, destination, flight number, departure date, departure time, cabin, fare class, baggage conditions, ticket restrictions, taxes, total price, availability, currency, timestamp, and source.
This creates a time-series structure capable of measuring:
- Absolute fare movement
- Percentage price change
- Intraday volatility
- Day-over-day volatility
- Seven-day rolling volatility
- Peak-to-trough decline
- Fare dispersion between airlines
- Price changes by booking window
- Route-level price elasticity
- Discount frequency
- Fare recovery after price drops
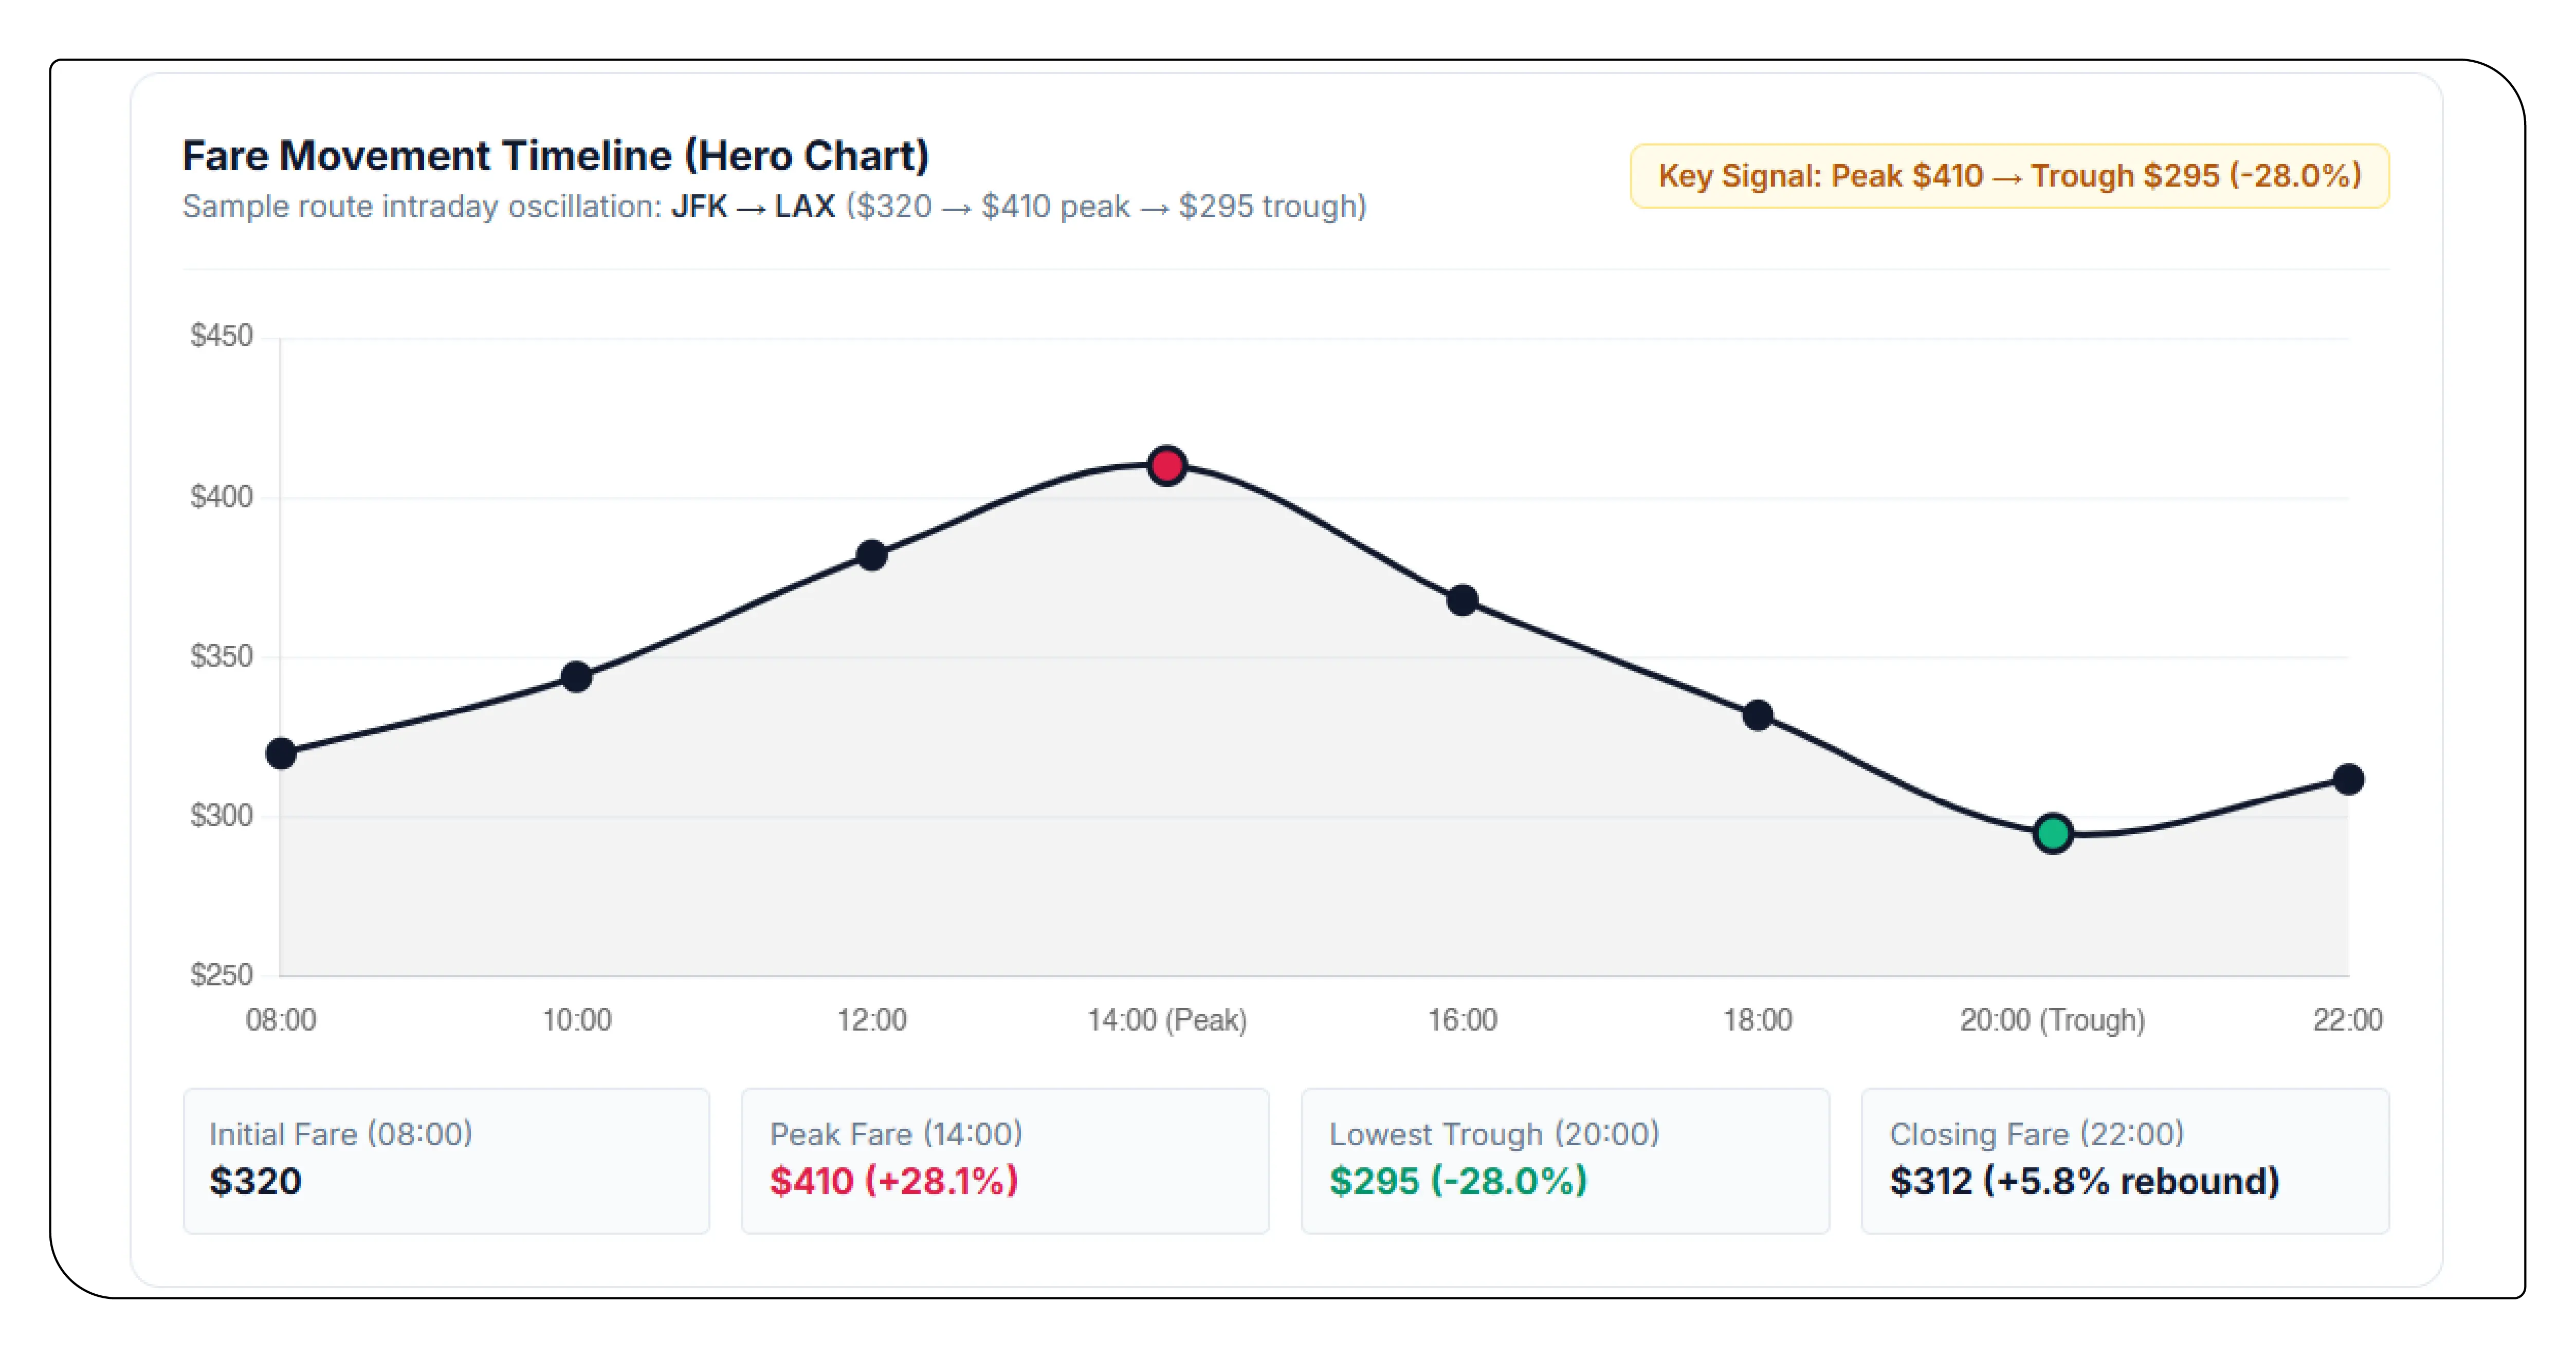
For example, if a route moves from $320 to $410 and then falls to $295, the average price alone does not communicate the market's instability. A time-stamped dataset captures the entire sequence and allows analysts to distinguish temporary promotions from persistent market repricing.
Booking Trend Insights and Consumer Behavior
Booking Trend Insights become especially valuable when airfare volatility is connected to purchase timing. Consumers rarely experience the average market price; they experience the fare available at the precise moment they search and purchase.
Early-booking travelers may encounter relatively stable inventory, while late bookers face fewer seats and potentially higher fare buckets. However, airlines can also release discounted inventory when demand underperforms expectations. This makes the traditional assumption that fares always rise as departure approaches incomplete.
A sophisticated dataset therefore tracks price trajectories by days-to-departure: 90 days, 60 days, 45 days, 30 days, 21 days, 14 days, 7 days, 3 days, and the final 24 hours.
This enables businesses to identify the booking windows in which prices most frequently decline, stabilize, or accelerate.
Airline, Airport, and Route-Level Differences
US Airfare Price volatility intelligence becomes considerably more powerful when the market is divided into route and airport segments.
A high-competition route may experience aggressive fare matching. A route dominated by one major carrier may demonstrate stronger pricing power. Minneapolis-St. Paul, for instance, recently recorded a particularly high average fare among major U.S. airports, while analysts linked reduced competition and carrier concentration to pricing pressure.
The distinction between leisure and business markets is also critical. Business-heavy routes may retain demand despite higher prices, while leisure markets can show sharper promotional cycles.
Premium-cabin pricing introduces another layer. Airlines increasingly rely on premium products and differentiated services to improve revenue performance, meaning economy fares and premium fares can exhibit very different volatility profiles.
Fare Fluctuation Alerts and Automated Monitoring
Fare Fluctuation Alerts can transform raw airfare observations into operational intelligence. Instead of reviewing thousands of fare records manually, a monitoring system can trigger notifications when predefined conditions occur.
For example, an alert can be generated when:
- A fare falls by more than 15%.
- A competitor undercuts the monitored airline by $40.
- A route's seven-day average rises above 20%.
- A fare drops below a historical percentile.
- Inventory decreases rapidly.
- A promotional fare appears.
- A route experiences abnormal volatility.
- A high-value corporate route crosses a budget threshold.
These alerts can support travel agencies, metasearch platforms, corporate travel teams, and revenue-management departments.
Building a US Flight Fare Data API
A US Flight Fare Data API can turn a continuously collected airfare database into a reusable intelligence layer. Instead of repeatedly gathering raw information, applications can request structured records based on route, airline, departure date, cabin, fare range, or volatility score.
A practical API architecture may expose endpoints for current fares, historical fares, fare changes, route comparisons, airline comparisons, and price-drop events.
For example, a travel application could request all fares for a route departing within the next 30 days and receive current price, previous observation, percentage movement, historical percentile, and volatility score.
Commercial Airfare Intelligence Architecture
| Data Layer | Example Fields | Update Frequency | Records/Day | Key Metric | Typical User | Business Application | Alert Threshold | Storage Format | API Output |
|---|---|---|---|---|---|---|---|---|---|
| Flight Schedule | Flight, route, time | 1–6 hours | 100K+ | Schedule change rate | OTA | Inventory planning | >5% change | JSON/Parquet | JSON |
| Fare Snapshot | Base fare, taxes, total | 15–60 min | 250K+ | Current fare | Travel platform | Price comparison | >10% move | PostgreSQL | JSON |
| Historical Fare | Timestamped fare | Hourly | 500K+ | Trend index | Analyst | Market research | >15% shift | Parquet | CSV/API |
| Competitor Fare | Airline + competitor price | 15–60 min | 200K+ | Price gap | Revenue team | Competitive pricing | >$40 gap | SQL | JSON |
| Inventory | Seats/fare buckets | 15–30 min | 150K+ | Availability | Airline | Yield management | >20% drop | NoSQL | API |
| Price Drop | Previous/current fare | Real time | 50K+ events | Drop percentage | Consumer app | Fare alerts | >10% drop | Event stream | Webhook |
| Route Volatility | Mean, SD, range | Hourly | 10K+ | Volatility score | Investor | Market intelligence | Score >75 | Warehouse | JSON |
| Booking Window | Days to departure | Daily | 75K+ | Optimal window | OTA | Conversion strategy | Threshold-based | SQL | API |
| Fuel Indicator | Fuel benchmark | Daily | 1K+ | Fuel movement | Airline analyst | Cost forecasting | >8% change | Warehouse | JSON |
| Demand Signal | Searches/bookings | Hourly | 1M+ | Demand index | Revenue manager | Demand forecasting | >15% change | Big-data store | API |
| Airport Pricing | Airport + fare | Daily | 30K+ | Airport fare index | Consultant | Geographic analysis | >10% deviation | SQL | CSV/API |
| Airline Benchmark | Carrier fare metrics | Daily | 20K+ | Competitiveness | Strategy team | Benchmarking | Rank shift | Warehouse | JSON |
The numbers in this architecture table are illustrative capacity targets for a commercial intelligence platform, not claims about the actual transaction volumes of any specific provider.
Flight Price Data Intelligence
Flight Price Data Intelligence combines historical observations with contextual variables. A useful system should not simply answer "What is today's fare?" It should answer "Is today's fare unusually high or low compared with comparable historical conditions?"
Machine-learning models can incorporate departure date, days to departure, route, carrier, airport, season, day of week, holiday periods, fare class, capacity indicators, competitor prices, and fuel-market signals.
A volatility index can then combine normalized measures of fare dispersion, percentage changes, price-drop frequency, and route instability. This gives businesses a standardized way to compare a volatile leisure route with a relatively stable business route.
Real-Time Flight Price Monitoring
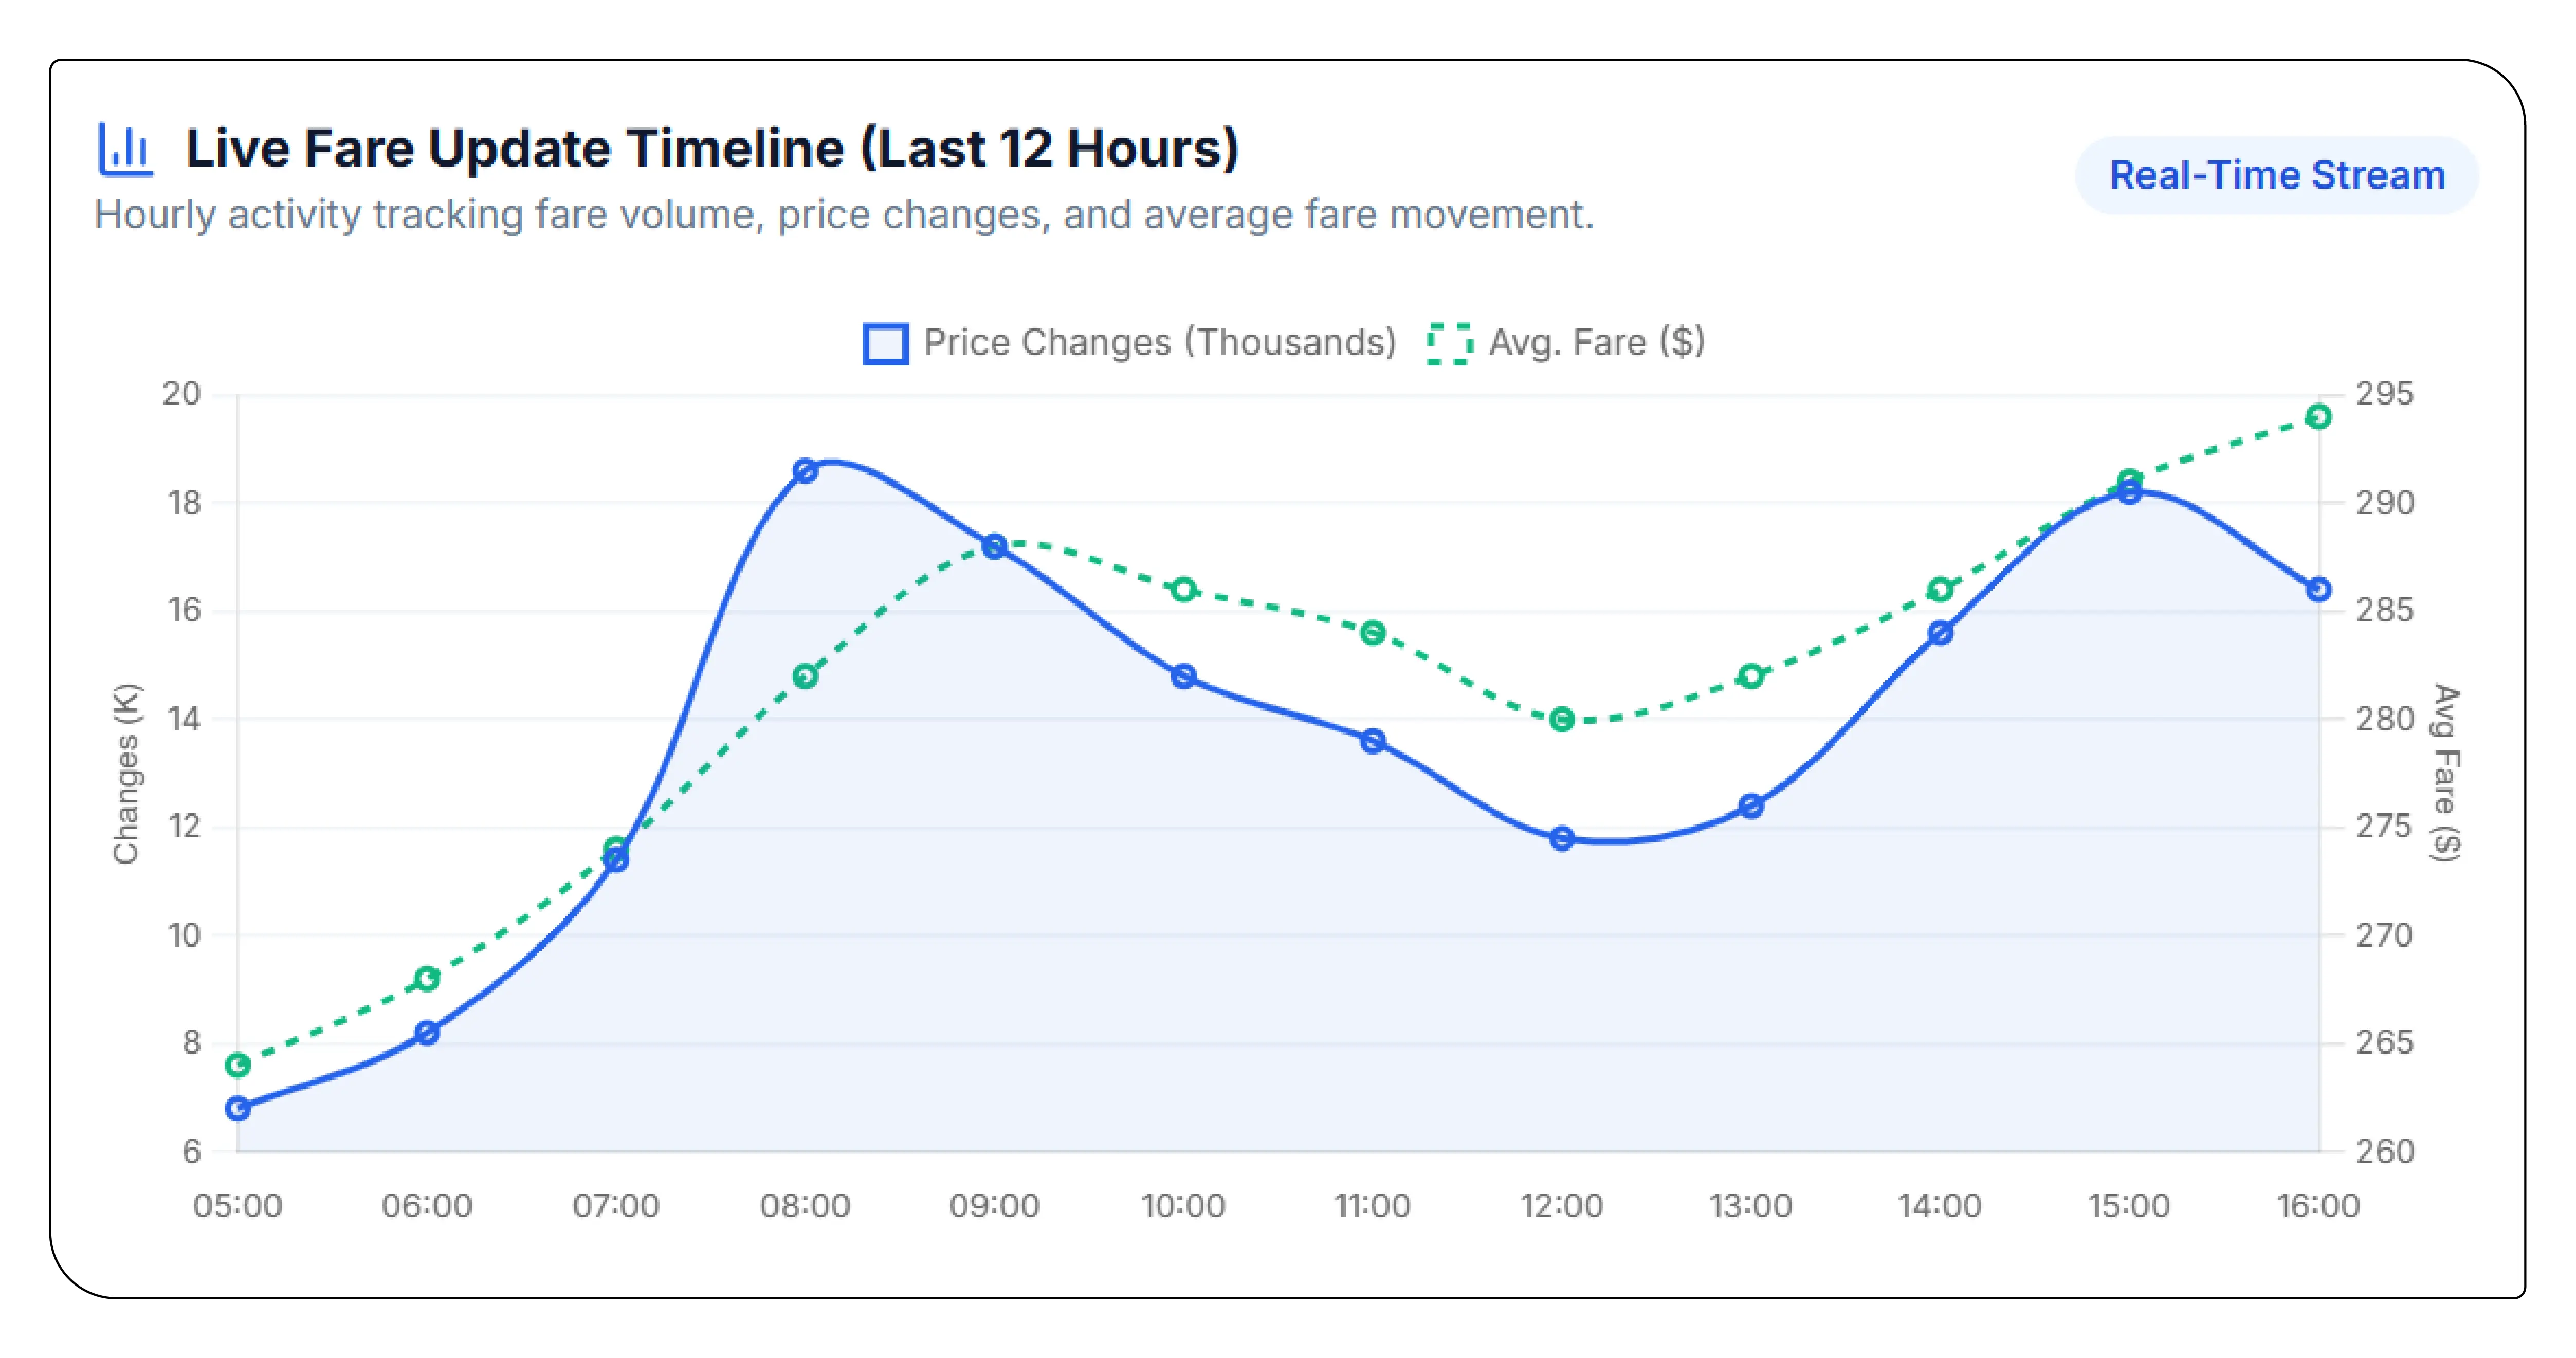
Real-Time Flight Price Monitoring US is increasingly important because fare information can become outdated quickly. A daily snapshot might miss several price changes occurring during peak booking periods.
Real-time monitoring uses scheduled or event-driven collection, timestamp normalization, duplicate detection, historical comparison, and automated anomaly detection. Data pipelines can distribute updates through APIs, dashboards, webhooks, cloud storage, or enterprise databases.
This capability is particularly valuable for travel companies that advertise "lowest fare" propositions. A stale price can produce failed searches, poor conversion, and customer dissatisfaction.
US Airfare Market Intelligence
US Airfare Market Intelligence extends beyond individual fares to reveal market structure. Analysts can evaluate which airlines are gaining pricing power, which airports are becoming expensive, where competition is intensifying, and which routes are experiencing abnormal demand.
The 2026 environment illustrates why this broader view matters. Airlines have been balancing elevated fuel expenses against resilient passenger demand, while aircraft supply constraints and operational limitations restrict how quickly capacity can expand. Recent reporting also shows airlines attempting to recover higher fuel costs through stronger fares while remaining cautious about aggressive price cuts.
This creates a feedback loop: higher costs encourage fare increases, strong demand supports those increases, constrained capacity reduces discounting pressure, and competitive responses determine how much of the cost increase reaches passengers.
Strategic Applications
The resulting dataset can support airline revenue management, travel-agency benchmarking, corporate travel procurement, metasearch engines, fare-alert applications, investment research, tourism analysis, and consumer travel platforms.
A corporate travel manager, for example, can compare negotiated fares with real-time market prices. An OTA can identify routes where competitors consistently offer lower prices. An investor can study fare trends alongside capacity and fuel costs. A travel application can identify unusual price drops and immediately notify users.
The strongest systems also preserve historical snapshots rather than overwriting old prices. Historical preservation is essential because volatility analysis depends on knowing what the price was before and after each change.
Conclusion
The U.S. airfare market in 2026 demonstrates that ticket pricing is becoming increasingly dynamic, contextual, and data-intensive. BTS reported a Q1 2026 average domestic fare of $428, while broader market conditions during the year have been affected by fuel-price volatility, capacity constraints, strong demand, and competitive shifts.
For businesses, the opportunity is therefore not merely to collect airfare prices but to transform continuous observations into actionable intelligence. Route-level histories, fare-change events, booking-window analysis, competitor comparisons, airport benchmarks, and real-time alerts can reveal patterns that conventional static datasets miss.
Most importantly, Demand Forecasting can connect historical fare movements with future purchasing behavior, allowing organizations to anticipate where prices may rise, where discounts may emerge, and where capacity constraints could create pricing pressure.
A well-designed airfare intelligence infrastructure can ultimately move decision-making from reactive price observation to proactive market prediction. In an environment where a fare can change multiple times before a traveler clicks "purchase," that transition from static data to continuous intelligence is becoming a strategic competitive advantage.
Ready to elevate your travel business with cutting-edge data insights? Scrape Aggregated Flight Fares to identify competitive rates and optimize your revenue strategies efficiently. Discover emerging opportunities with tools to Extract Travel Website Data, leveraging comprehensive data to forecast market shifts and enhance your service offerings. Real-Time Travel App Data Scraping Services helps stay ahead of competitors, gaining instant insights into bookings, promotions, and customer behavior across multiple platforms. Get in touch with Travel Scrape today to explore how our end-to-end data solutions can uncover new revenue streams, enhance your offerings, and strengthen your competitive edge in the travel market.
Unlock the Full Report
Enter your details to access premium pricing intelligence insights