Scraping Cruise Industry 2026 for Cabin Pricing Data to Track Record-Breaking Demand
Introduction
The global cruise market is entering 2026 with unusually strong demand signals. CLIA reported that global ocean-going cruise passenger volume reached a historic 37.2 million in 2025, while industry forecasts point toward continued growth in 2026. AAA has projected 21.7 million Americans will cruise in 2026, representing another year of growth.
For businesses tracking this expansion, Scraping Cruise Industry 2026 data has become increasingly important because headline passenger numbers alone cannot explain how demand is affecting individual cabins, itineraries, sailing dates, and price points.
Cruise Data Scraping enables analysts to capture cabin-level information repeatedly across booking windows, destinations, ships, departure dates, occupancy indicators, promotional offers, and fare categories. Instead of viewing cruise pricing as a static number, businesses can construct a time series showing how prices react as inventory becomes constrained.
Scraping Cabin Pricing Data provides an especially useful lens because cruise inventory is highly segmented. An inside cabin, ocean-view room, balcony cabin, suite, and premium accommodation can experience completely different pricing trajectories on the same sailing.
Why Cabin-Level Pricing Is Becoming a Demand Signal?
Cruise pricing increasingly resembles other dynamic travel categories. Cruise lines are using dynamic fares, tiered packages and additional fees, making the relationship between booking timing and final price more complex. Industry reporting in 2026 has also highlighted the growing importance of close-in bookings and pricing power on popular sailings.
This creates an important analytical opportunity: Demand Forecasting can be strengthened by observing price movement rather than waiting for confirmed passenger-volume statistics.
Suppose an itinerary starts with an inside cabin at $899 and a balcony cabin at $1,499. Several weeks later, the inside cabin rises to $1,049 while the balcony increases to $1,799. If suites simultaneously become unavailable, the combined movement can indicate tightening inventory.
The key is not simply recording the highest price. Analysts need to record the direction, speed, frequency, and magnitude of price changes.
Illustrative Cabin Pricing Dataset
| Sailing ID | Region | Ship Type | Departure Month | Cabin Type | Initial Fare ($) | Week 4 Fare ($) | Week 8 Fare ($) | Week 12 Fare ($) | Price Increase % | Promo Discount % | Inventory Signal | Demand Score |
|---|---|---|---|---|---|---|---|---|---|---|---|---|
| CR-101 | Caribbean | Large | Jan | Inside | 799 | 849 | 929 | 999 | 25.0% | 5% | Tightening | 82 |
| CR-101 | Caribbean | Large | Jan | Ocean View | 999 | 1,049 | 1,149 | 1,249 | 25.0% | 4% | Tightening | 85 |
| CR-101 | Caribbean | Large | Jan | Balcony | 1,299 | 1,399 | 1,549 | 1,699 | 30.8% | 3% | Very Tight | 91 |
| CR-101 | Caribbean | Large | Jan | Suite | 2,799 | 2,999 | 3,249 | 3,599 | 28.6% | 2% | Scarce | 95 |
| CR-102 | Mediterranean | Premium | May | Inside | 899 | 919 | 979 | 1,049 | 16.7% | 8% | Stable | 71 |
| CR-102 | Mediterranean | Premium | May | Ocean View | 1,099 | 1,149 | 1,249 | 1,349 | 22.8% | 6% | Tightening | 78 |
| CR-102 | Mediterranean | Premium | May | Balcony | 1,499 | 1,599 | 1,749 | 1,949 | 30.0% | 4% | Very Tight | 88 |
| CR-102 | Mediterranean | Premium | May | Suite | 3,099 | 3,299 | 3,699 | 4,099 | 32.3% | 2% | Scarce | 94 |
| CR-103 | Alaska | Large | Jul | Inside | 1,199 | 1,249 | 1,349 | 1,499 | 25.0% | 3% | Tightening | 86 |
| CR-103 | Alaska | Large | Jul | Ocean View | 1,499 | 1,599 | 1,749 | 1,949 | 30.0% | 2% | Very Tight | 92 |
| CR-103 | Alaska | Large | Jul | Balcony | 1,899 | 2,049 | 2,299 | 2,599 | 36.9% | 2% | Scarce | 97 |
| CR-103 | Alaska | Large | Jul | Suite | 3,799 | 4,099 | 4,499 | 4,999 | 31.6% | 1% | Scarce | 98 |
| CR-104 | Europe | River | Sep | Standard | 1,699 | 1,749 | 1,849 | 1,949 | 14.7% | 7% | Stable | 69 |
| CR-104 | Europe | River | Sep | Balcony | 2,099 | 2,199 | 2,349 | 2,499 | 19.1% | 5% | Tightening | 77 |
| CR-104 | Europe | River | Sep | Suite | 3,199 | 3,399 | 3,699 | 3,999 | 25.0% | 3% | Very Tight | 89 |
Note: Figures in this table are illustrative modeling values created to demonstrate the analytical structure, not reported operator fares.
From Price Changes to Demand Intelligence
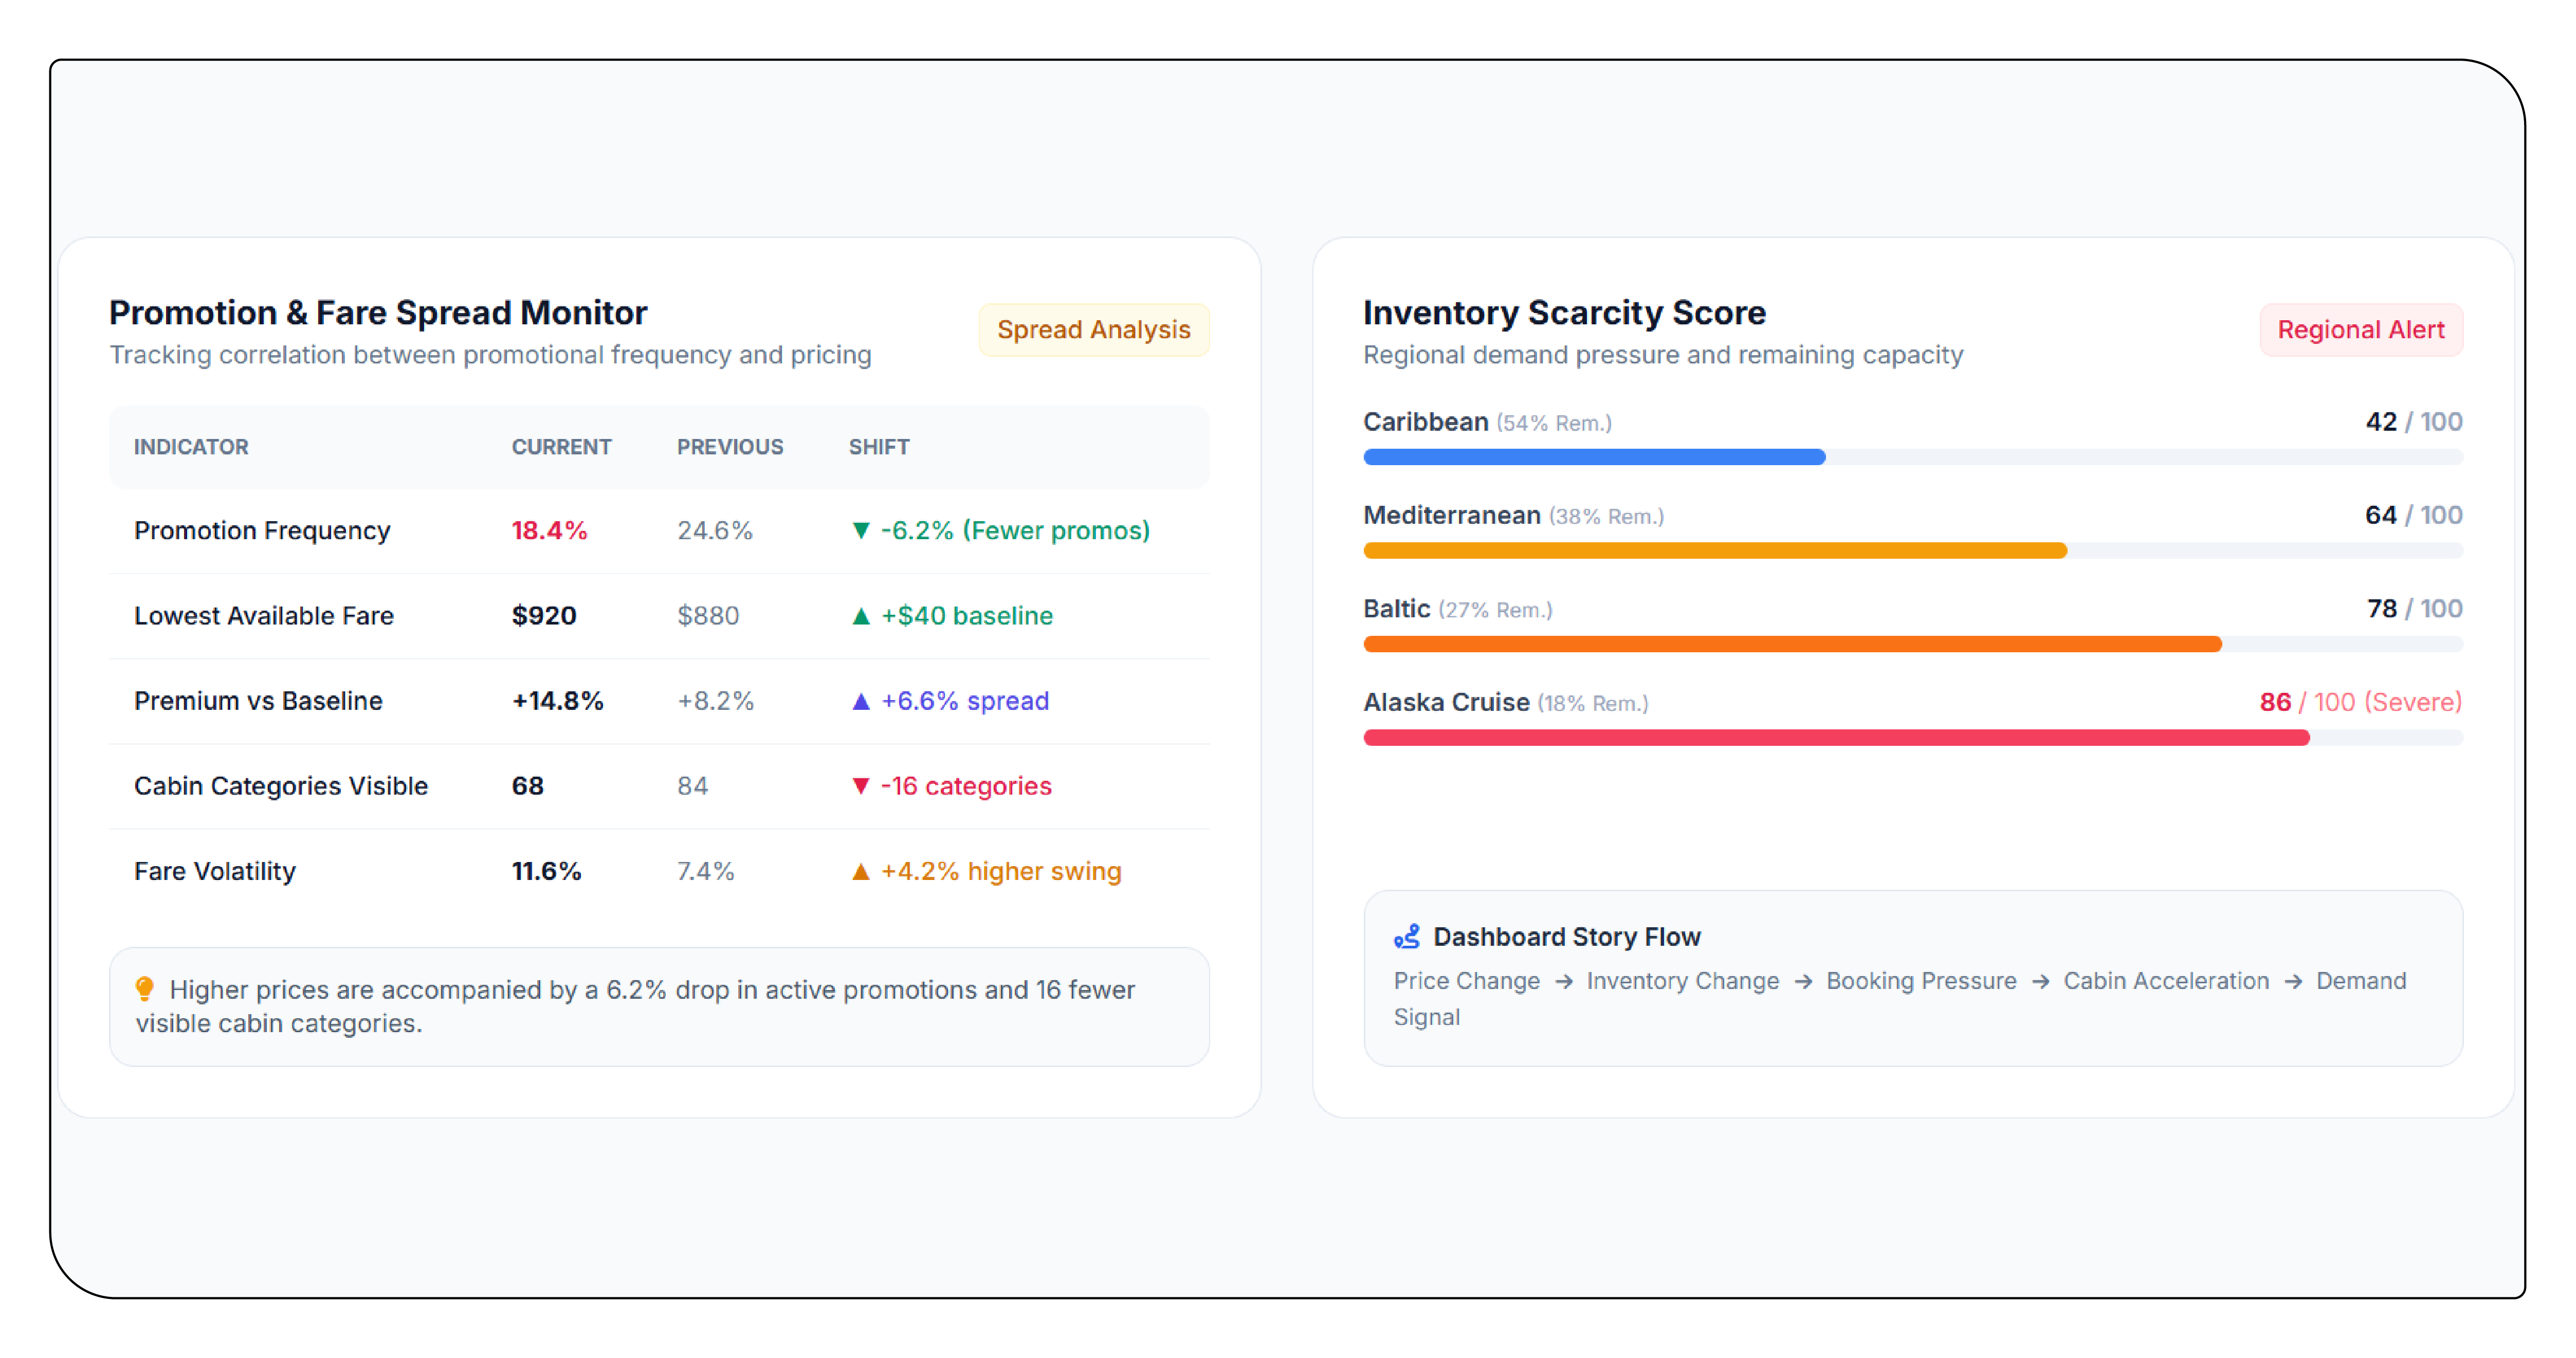
The real value emerges when individual observations are transformed into indicators. A 5% price increase across an itinerary may not mean much if inventory remains abundant. However, a 20% increase combined with shrinking cabin availability, fewer promotions, and shorter booking windows can indicate much stronger demand.
This is where Cruise Record-Breaking Demand tracking becomes measurable through repeated observations.
Analysts can calculate several indicators:
- Average cabin fare by sailing
- Price growth by booking window
- Cabin-level price acceleration
- Fare spread between cabin categories
- Promotion frequency
- Days until departure
- Number of visible cabin categories
- Lowest available fare
- Premium over baseline fare
- Price volatility
- Inventory scarcity score
A particularly useful measure is cruise pricing intelligence 2026, which combines these signals into a continuously updated market view. Instead of asking whether cruises are generally expensive, analysts can identify which destinations, sailing periods, ships, and cabin categories are experiencing the strongest pricing pressure.
Understanding Cabin Fare Differences
Cabin segmentation provides another layer of insight. A balcony cabin can appreciate significantly faster than an inside cabin when travelers prioritize views and outdoor space. Similarly, premium suites may show strong price increases even when standard cabins remain comparatively stable.
This makes Cruise Pricing Intelligence useful for revenue teams, travel agencies, cruise marketplaces, investors, and destination analysts.
A structured cruise fare difference dataset by cabin type can calculate the absolute and percentage gap between categories over time.
For example, analysts might monitor:
Balcony Fare − Inside Fare
and
Suite Fare ÷ Inside Fare
A growing balcony-to-inside premium can signal stronger preference for upgraded accommodations. A narrowing premium could indicate weaker demand for premium inventory or increased promotional activity.
Comparing Destinations and Booking Windows
Demand rarely develops uniformly across the cruise market. Caribbean, Mediterranean, Alaska, Northern Europe, Asian and expedition itineraries can follow different booking cycles.
The following illustrative dataset demonstrates how a market intelligence system can compare demand signals across regions.
Illustrative Regional Demand & Pricing Intelligence Dataset
| Region | Avg Sailing Fare ($) | 30-Day Price Growth % | 60-Day Price Growth % | 90-Day Price Growth % | Avg Balcony Premium % | Avg Suite Premium % | Promo Frequency % | Avg Booking Lead Days | Cabin Scarcity Index | Demand Index | YoY Demand Signal % |
|---|---|---|---|---|---|---|---|---|---|---|---|
| Caribbean | 1,485 | 8.6 | 16.4 | 25.7 | 36.2 | 112.4 | 18 | 142 | 84 | 91 | 12.8 |
| Mediterranean | 1,672 | 6.9 | 14.8 | 23.5 | 39.8 | 118.7 | 22 | 156 | 79 | 86 | 10.9 |
| Alaska | 2,145 | 10.7 | 21.5 | 34.2 | 42.7 | 124.9 | 14 | 181 | 93 | 96 | 15.4 |
| Northern Europe | 1,921 | 7.3 | 15.9 | 26.1 | 38.4 | 116.2 | 19 | 168 | 82 | 88 | 11.7 |
| Asia | 1,354 | 5.8 | 11.7 | 19.6 | 31.5 | 98.7 | 27 | 119 | 68 | 73 | 8.2 |
| Australia | 1,746 | 6.2 | 13.6 | 22.8 | 35.9 | 109.3 | 21 | 149 | 76 | 81 | 9.6 |
| Expedition | 3,845 | 11.8 | 23.7 | 37.5 | 46.3 | 137.8 | 9 | 204 | 95 | 98 | 17.1 |
| River Europe | 2,018 | 6.5 | 12.9 | 21.4 | 29.8 | 103.6 | 24 | 173 | 74 | 80 | 9.1 |
Note: Figures are illustrative analytical values designed to demonstrate how a regional pricing dataset can be structured.
The dataset shows why Seasonal Trend Analysis matters. A region may demonstrate moderate annual growth while experiencing sharp pricing acceleration during a particular month. Looking only at annual averages would conceal this movement.
For example, Alaska and expedition cruises can exhibit strong seasonal constraints because capacity is limited and specific travel periods are highly desirable. A sudden reduction in available balcony or suite inventory can therefore create disproportionate price movement.
Detecting Emerging Booking Patterns
Modern cruise analysis should not rely exclusively on historical averages. Businesses need to understand whether travelers are booking earlier, later, upgrading cabins, responding to promotions, or concentrating demand around particular departure periods.
A structured cruise booking trends analysis 2026 framework can track the evolution of these behaviors week by week.
One valuable indicator is booking-window compression. If the median observed fare begins increasing significantly during the final 60 days before departure, the market may be showing stronger close-in demand.
Conversely, if fares fall rapidly during the final weeks, it can suggest excess inventory, weaker demand, or promotional intervention.
The distinction is important because falling prices do not automatically indicate a weak destination. They may simply indicate a cruise line is strategically stimulating bookings.
Building a Cruise Market Intelligence Layer
The next stage is combining cabin prices with external market variables. cruise market intelligence 2026 can integrate:
- Sailing schedules
- Ship capacity
- Cabin categories
- Fare changes
- Promotional offers
- Departure dates
- Destination popularity
- Port combinations
- Booking windows
- Historical pricing
- Search trends
- Competitor pricing
- Seasonal patterns
This creates a richer demand model than a conventional fare tracker.
For travel agencies, the intelligence can reveal when to promote alternative sailings. For cruise marketplaces, it can identify rapidly appreciating inventory. For revenue teams, it can highlight cabin categories where pricing power is increasing.
Turning Scraped Data Into Forecasts
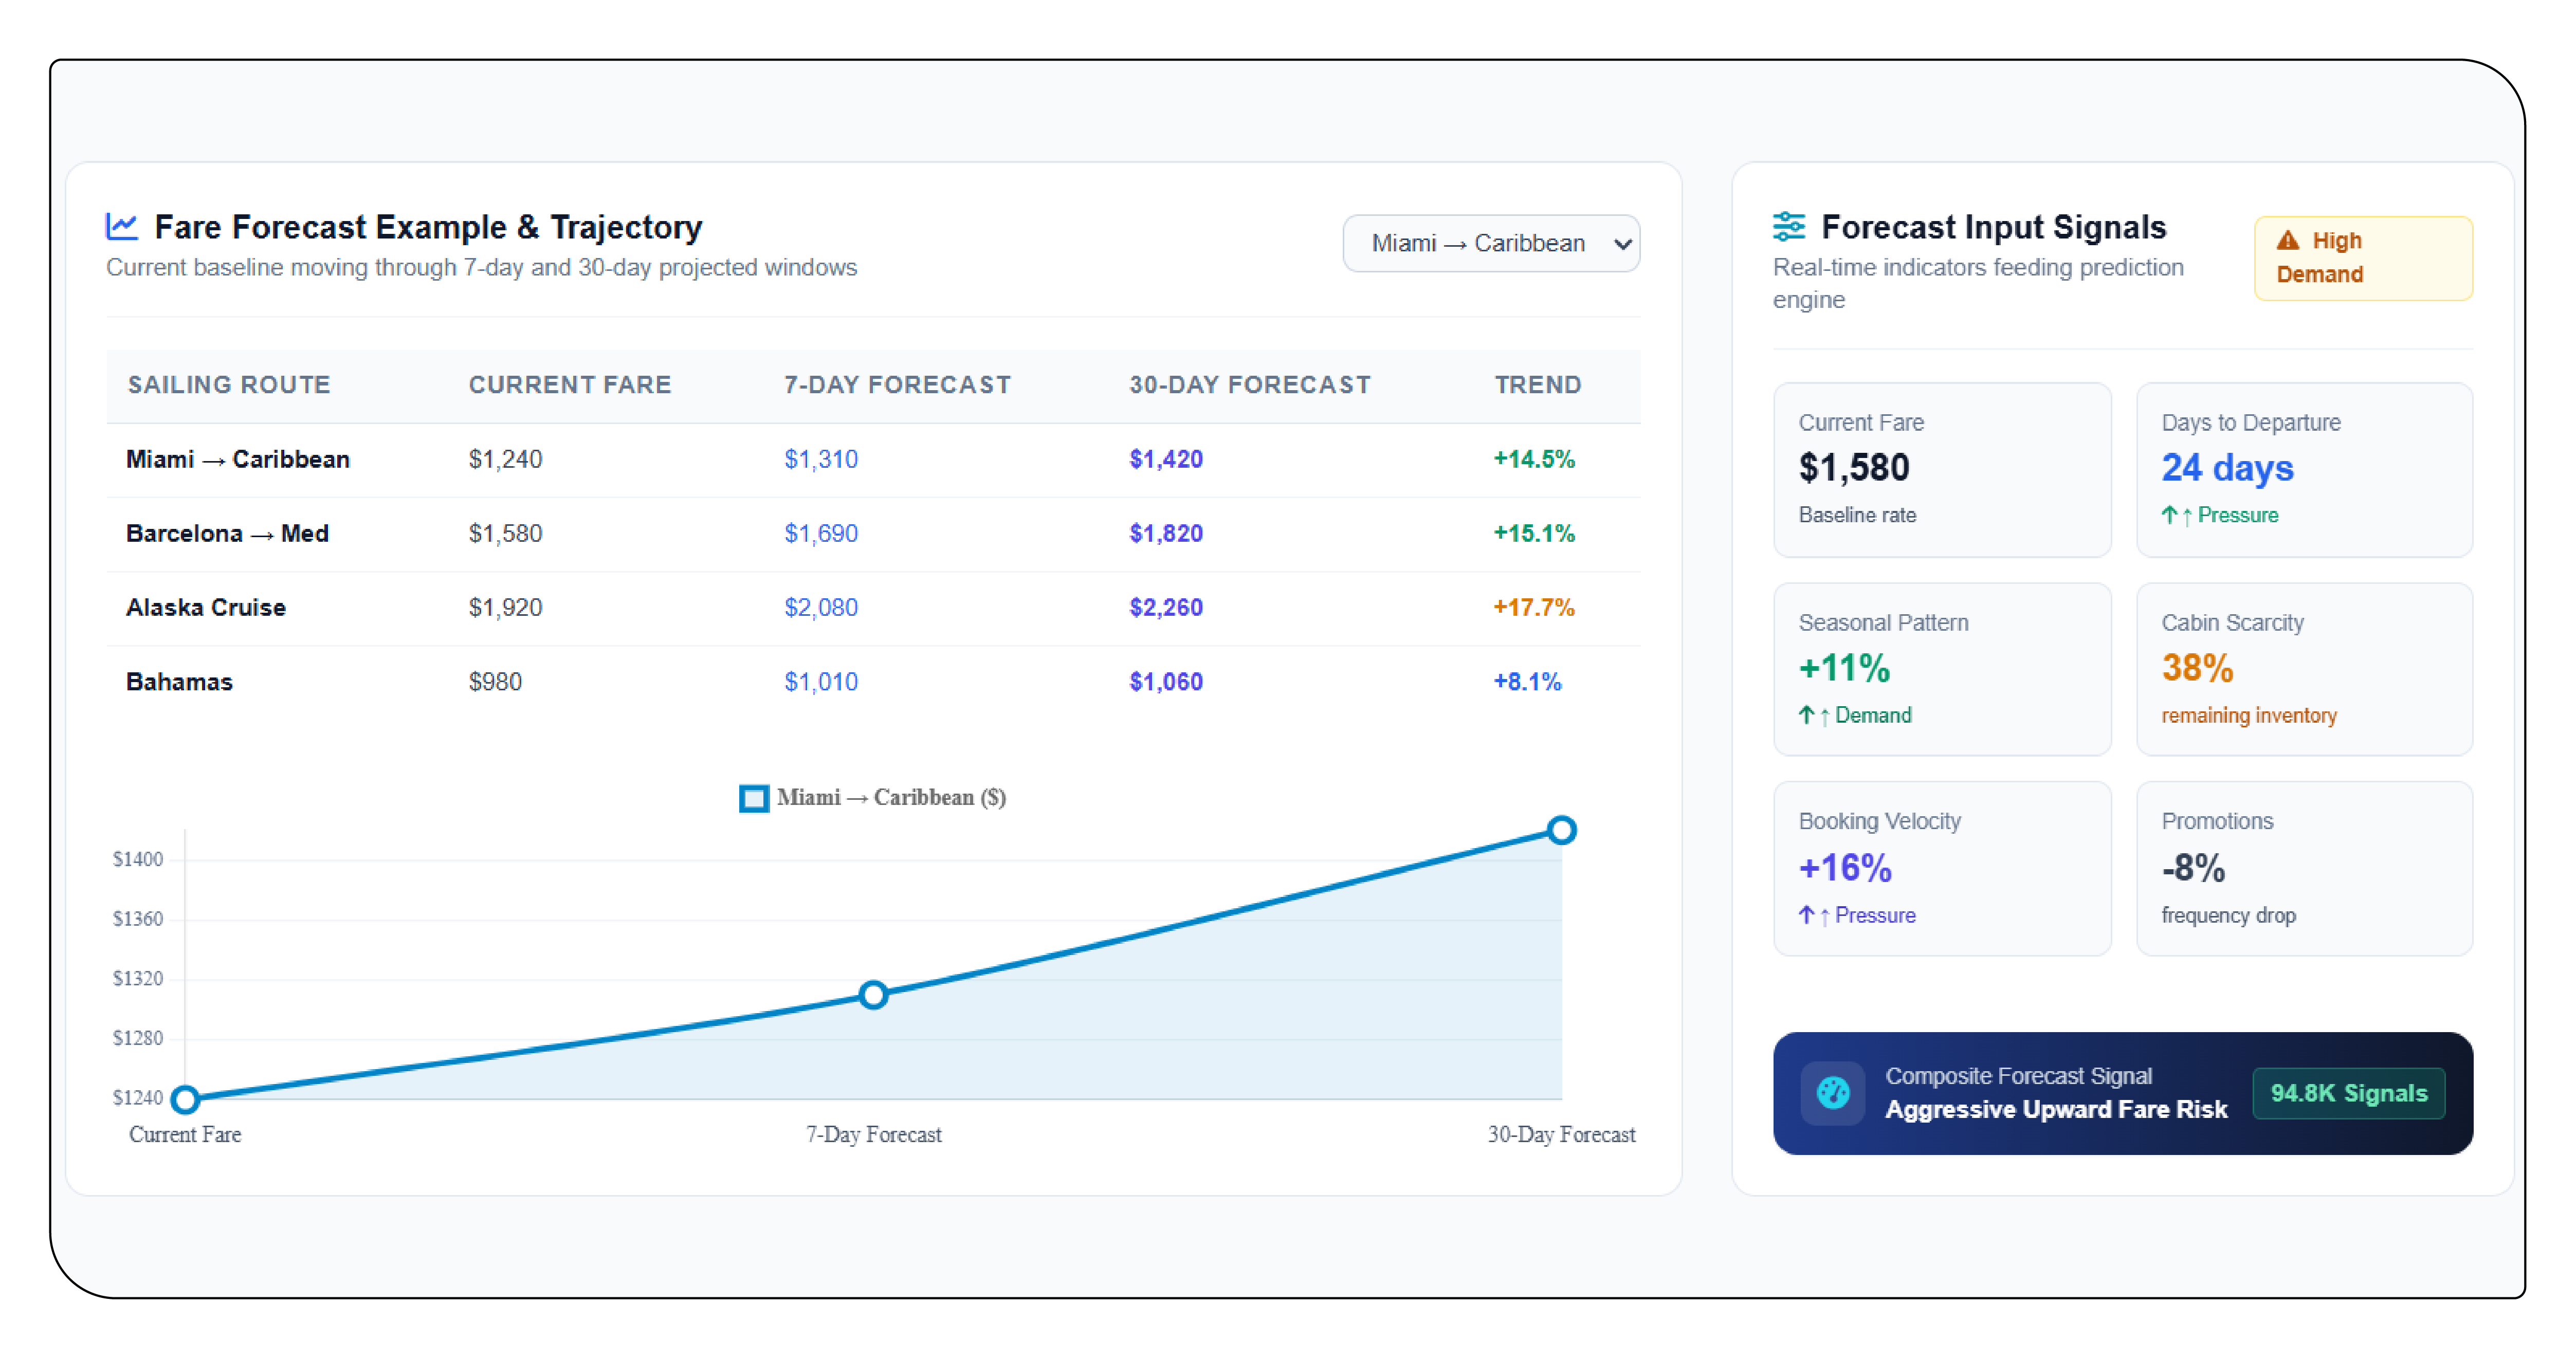
The most sophisticated applications move beyond descriptive dashboards. Historical observations can be converted into predictive indicators.
A model can estimate expected fare movement based on:
Current fare + days to departure + historical seasonal pattern + cabin scarcity + booking velocity + promotional activity.
Repeated collection is essential because a single snapshot cannot distinguish a temporary discount from a persistent pricing trend.
A useful forecasting system can produce scenarios such as:
- Expected fare increase over 7 days
- Expected fare increase over 30 days
- Probability of cabin scarcity
- Probability of promotional pricing
- Expected premium for upgraded cabins
- Expected peak-demand period
This allows businesses to shift from simply monitoring prices to anticipating them.
Why Record Demand Requires Continuous Monitoring?
The strength of the 2026 cruise market makes continuous observation particularly valuable. CLIA's 2026 report highlights the industry's record passenger volumes and strong intent to cruise again, while other 2026 reporting indicates that major operators have entered the year with strong booking positions.
At the same time, demand is not perfectly uniform. Recent reporting has pointed to regional differences, including softer demand in certain Mediterranean and Mexican Riviera markets, illustrating why aggregate industry statistics cannot substitute for route-level monitoring.
The result is a market where capacity, timing, destination, cabin category and pricing strategy increasingly interact.
Conclusion
The cruise industry has moved beyond a simple model of fixed seasonal fares. Dynamic pricing, changing booking windows, differentiated cabin demand and increasingly sophisticated revenue strategies mean that price itself has become a valuable demand signal.
Dynamic Pricing Intelligence transforms repeated cabin-level observations into a forward-looking system capable of identifying price acceleration, scarcity, seasonal opportunities and emerging demand patterns.
For businesses operating in travel analytics, cruise marketplaces, revenue management or competitive intelligence, the opportunity is therefore much larger than collecting cruise prices. Continuous cabin-level datasets can reveal where demand is accelerating, which cabin categories are gaining pricing power, when inventory is tightening, and how quickly market conditions are changing.
As cruise passenger volumes continue expanding and operators introduce new ships, itineraries and premium experiences, granular pricing intelligence will become increasingly important. The organizations that connect cabin-level fare movements with booking windows, inventory signals and seasonal behavior will be better positioned to recognize record-breaking demand before it becomes visible in traditional industry statistics.
Ready to elevate your travel business with cutting-edge data insights? Scrape Aggregated Flight Fares to identify competitive rates and optimize your revenue strategies efficiently. Discover emerging opportunities with tools to Extract Travel Website Data, leveraging comprehensive data to forecast market shifts and enhance your service offerings. Real-Time Travel App Data Scraping Services helps stay ahead of competitors, gaining instant insights into bookings, promotions, and customer behavior across multiple platforms. Get in touch with Travel Scrape today to explore how our end-to-end data solutions can uncover new revenue streams, enhance your offerings, and strengthen your competitive edge in the travel market.
Unlock the Full Report
Enter your details to access premium pricing intelligence insights