Tracking Days-on-Market & Cost Trends Across Vancouver Rental Listings for Smarter Rental Market Intelligence
Introduction
The Vancouver rental market remains one of the most dynamic housing sectors in Canada. Rising population growth, continued immigration, evolving work patterns, and housing affordability challenges have significantly influenced rental demand across Metro Vancouver. Property owners, investors, real estate agencies, and housing analysts increasingly rely on data-driven intelligence to understand how rental listings perform and how pricing changes affect occupancy rates.
Tracking Days-on-Market & Cost Trends Across Vancouver Rental Listings has emerged as a critical approach for evaluating rental market efficiency and identifying areas with strong tenant demand. Days-on-Market (DOM) provides a measurable indicator of how quickly rental properties attract tenants and convert into occupied units.
Property Listing Analysis enables stakeholders to assess listing performance, compare neighborhoods, identify pricing opportunities, and improve leasing strategies. By monitoring listing duration and rental costs simultaneously, market participants can gain a more complete understanding of rental market conditions.
Vancouver rental market analytics has become increasingly important as organizations seek real-time visibility into rental inventory, vacancy trends, and price movements. Advanced analytics solutions now allow market participants to track thousands of rental listings across multiple platforms and neighborhoods.
Understanding Days-on-Market as a Key Rental Indicator
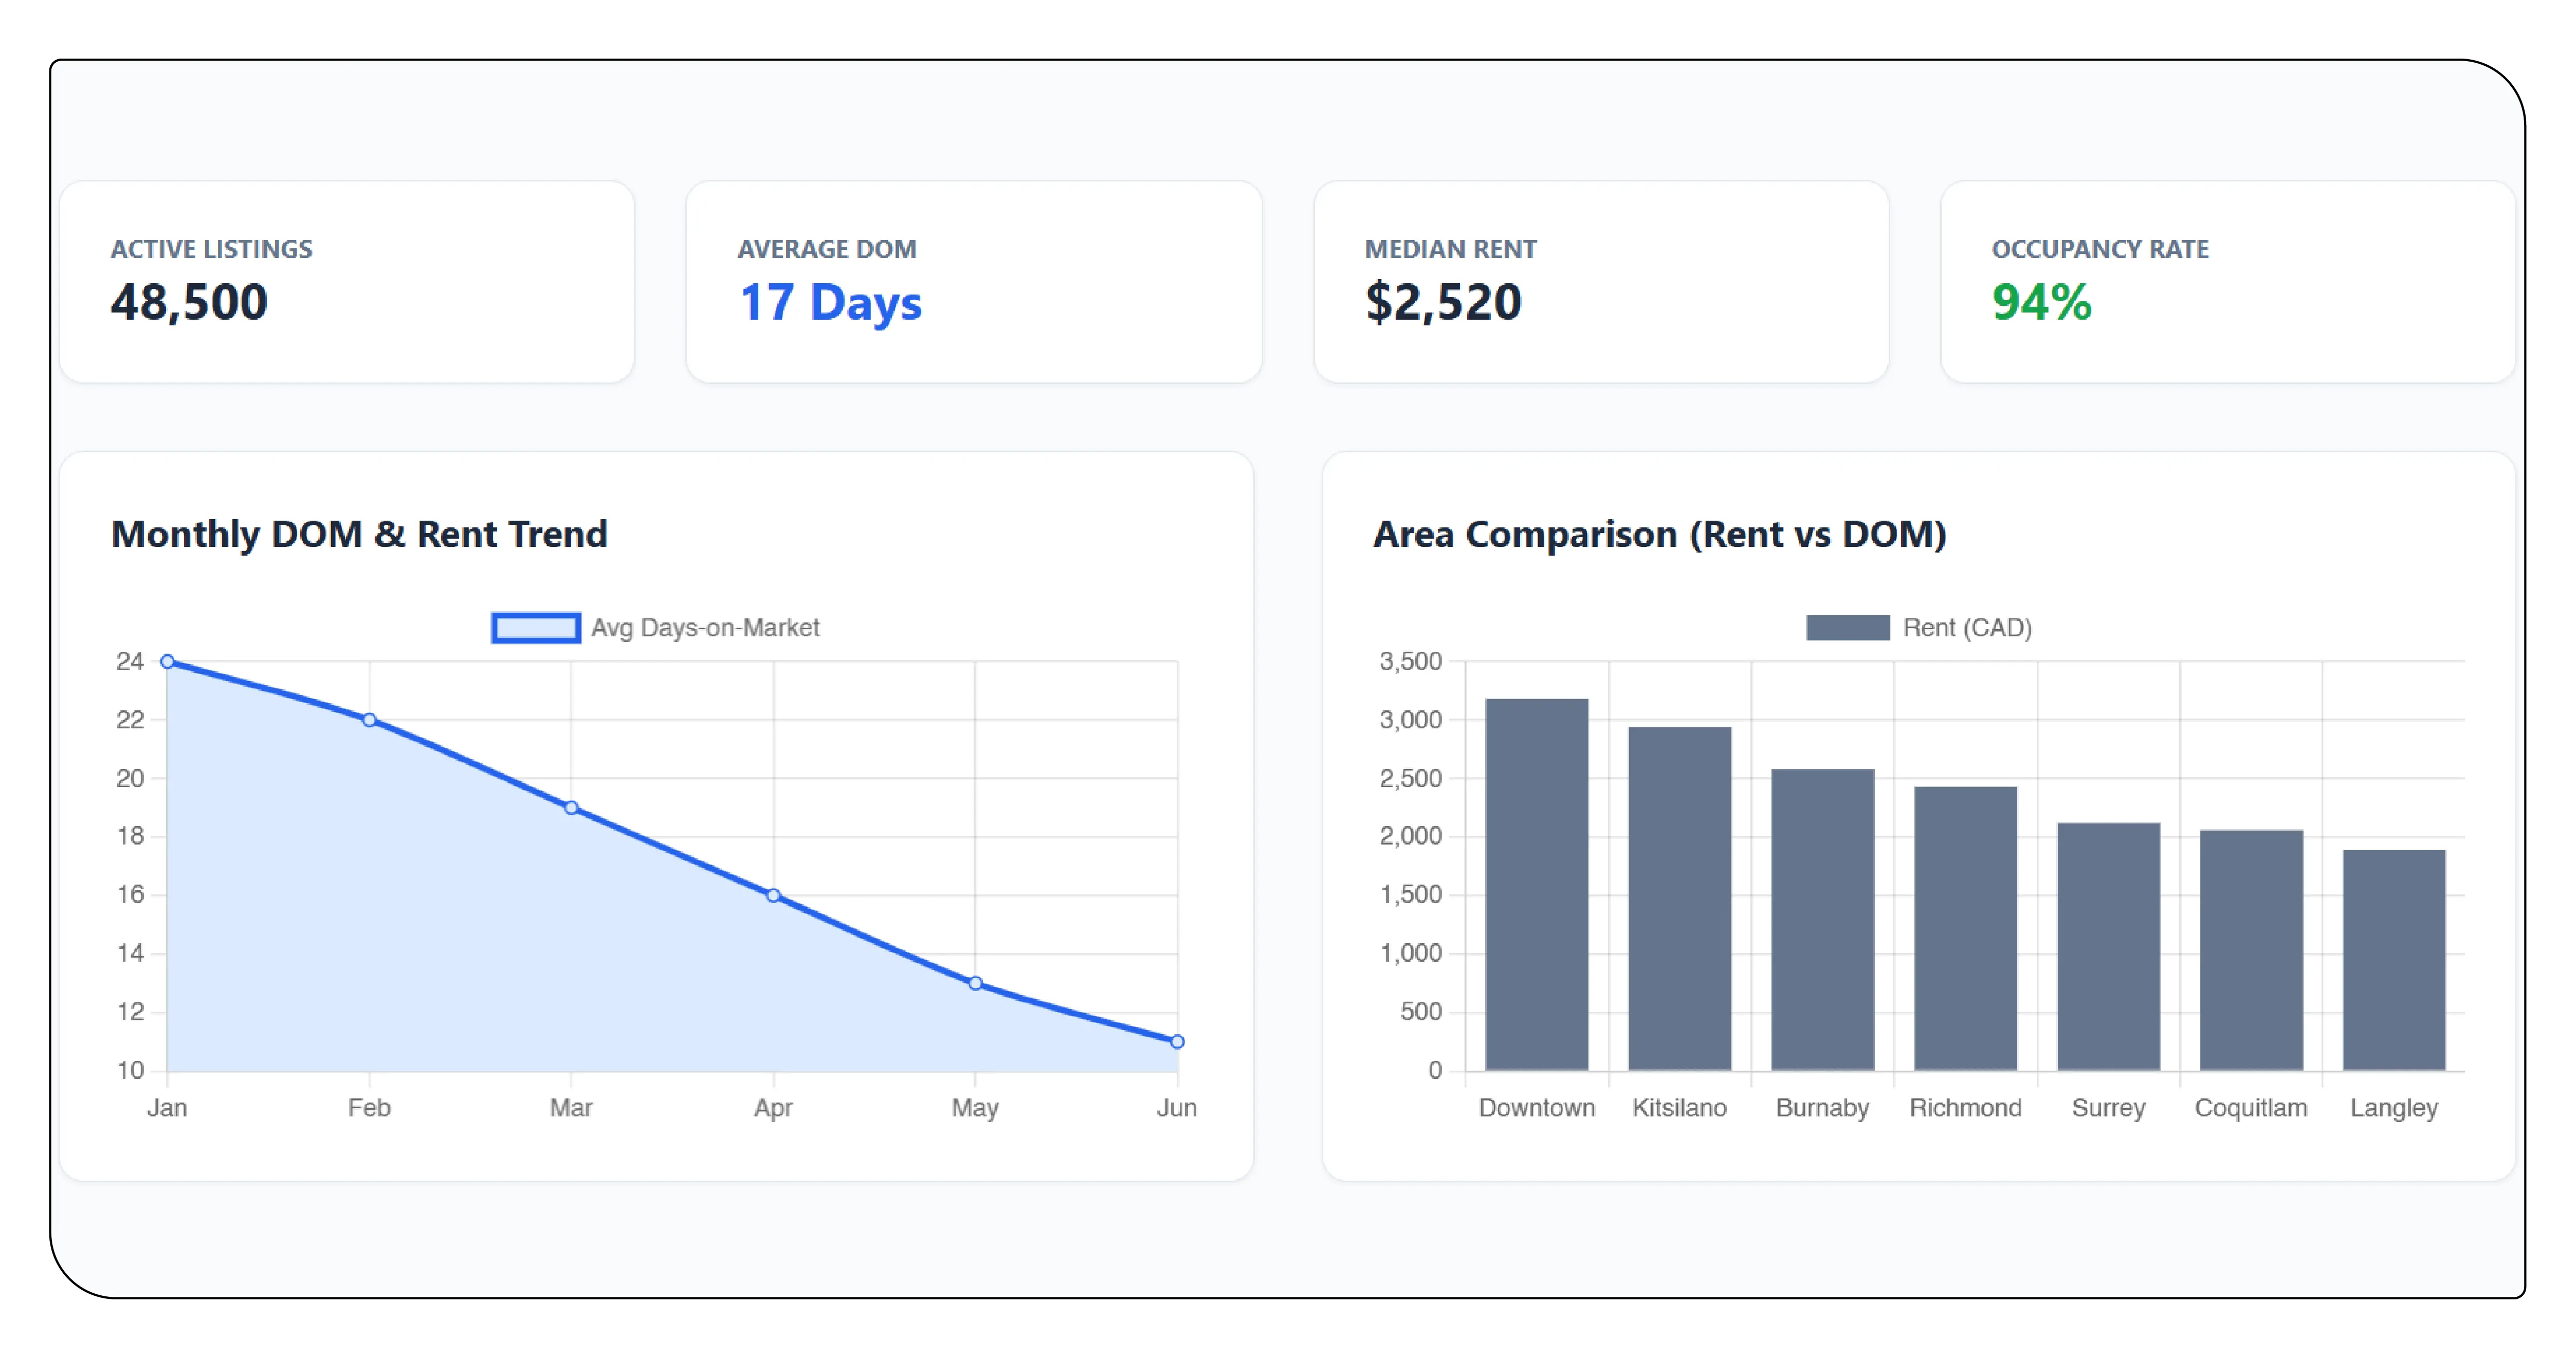
Days-on-Market represents the average number of days a rental property remains publicly listed before being leased. This metric serves as a direct indicator of market demand and rental competitiveness. Properties that lease quickly often indicate strong tenant demand, competitive pricing, attractive amenities, and favorable locations.
Conversely, properties that remain available for extended periods may signal pricing challenges, lower neighborhood demand, or increased competition from similar rental inventory. Monitoring listing duration allows landlords and property managers to make timely pricing adjustments and improve leasing performance.
In Metro Vancouver, DOM trends vary considerably between urban core neighborhoods and suburban regions. Downtown Vancouver and Kitsilano generally experience shorter leasing periods due to strong demand, while emerging suburban markets may exhibit longer listing durations despite offering lower rental costs.
Metro Vancouver Rental Listing Performance
Regional Rental Listing Performance Across Metro Vancouver (2026)
| Region | Avg Monthly Rent (CAD) | Avg Days on Market | Vacancy Rate (%) | Active Listings | Leased Units | Annual Rent Growth (%) |
|---|---|---|---|---|---|---|
| Downtown Vancouver | 3180 | 12 | 1.4 | 4820 | 4215 | 6.8 |
| West End | 2940 | 14 | 1.7 | 3965 | 3402 | 5.9 |
| Kitsilano | 2880 | 15 | 1.8 | 3241 | 2766 | 5.6 |
| Mount Pleasant | 2790 | 16 | 1.9 | 2985 | 2492 | 5.3 |
| Burnaby | 2620 | 18 | 2.2 | 4160 | 3285 | 5.1 |
| Richmond | 2580 | 20 | 2.5 | 3875 | 2964 | 4.8 |
| North Vancouver | 2910 | 17 | 1.9 | 2880 | 2362 | 5.7 |
| Surrey | 2180 | 23 | 3.1 | 6215 | 4523 | 4.2 |
| Coquitlam | 2310 | 22 | 2.8 | 3640 | 2715 | 4.5 |
| Langley | 2090 | 25 | 3.4 | 2980 | 2080 | 4.0 |
| New Westminster | 2280 | 21 | 2.7 | 2415 | 1804 | 4.6 |
| Port Moody | 2420 | 20 | 2.4 | 1740 | 1355 | 4.8 |
The data demonstrates that central Vancouver neighborhoods continue to maintain stronger rental demand compared to suburban markets. Lower vacancy rates and shorter listing durations contribute to sustained rental price growth in these areas.
Rental Pricing Dynamics and Market Behavior
Rental pricing trends closely correlate with listing duration. Markets experiencing high tenant demand generally support stronger pricing power and shorter leasing cycles. Property owners who understand these relationships can optimize rental rates while minimizing vacancy exposure.
Vacation Rental Data Scraping provides valuable intelligence regarding pricing fluctuations, listing updates, occupancy trends, and seasonal demand patterns. Automated collection methods allow analysts to continuously monitor thousands of listings and identify emerging market shifts.
Seasonality also plays an important role in rental market performance. Leasing activity typically increases during spring and summer months when students, professionals, and relocating families actively search for housing. During these periods, rental units often lease faster and support higher rental rates.
Rental Market Trends by Month
Monthly Rental Market Performance Trends (2025–2026)
| Month | Avg Rent (CAD) | Avg Days on Market | New Listings | Leased Units | Vacancy Rate (%) | Monthly Rent Growth (%) |
|---|---|---|---|---|---|---|
| Jan 2025 | 2465 | 24 | 9820 | 8145 | 2.9 | 0.8 |
| Feb 2025 | 2478 | 23 | 9965 | 8356 | 2.8 | 0.9 |
| Mar 2025 | 2495 | 21 | 10215 | 8775 | 2.6 | 1.0 |
| Apr 2025 | 2518 | 20 | 10480 | 9035 | 2.5 | 1.1 |
| May 2025 | 2544 | 18 | 10920 | 9560 | 2.3 | 1.2 |
| Jun 2025 | 2571 | 17 | 11145 | 9825 | 2.2 | 1.2 |
| Jul 2025 | 2595 | 16 | 11360 | 10042 | 2.1 | 1.1 |
| Aug 2025 | 2618 | 15 | 11520 | 10318 | 2.0 | 1.0 |
| Sep 2025 | 2637 | 16 | 11105 | 9915 | 2.1 | 0.9 |
| Oct 2025 | 2651 | 18 | 10765 | 9320 | 2.3 | 0.7 |
| Nov 2025 | 2660 | 21 | 10210 | 8735 | 2.5 | 0.5 |
| Dec 2025 | 2664 | 24 | 9680 | 8110 | 2.8 | 0.3 |
| Jan 2026 | 2678 | 23 | 9940 | 8415 | 2.7 | 0.7 |
| Feb 2026 | 2695 | 22 | 10180 | 8690 | 2.6 | 0.8 |
| Mar 2026 | 2718 | 20 | 10525 | 9085 | 2.4 | 1.0 |
| Apr 2026 | 2744 | 19 | 10875 | 9440 | 2.3 | 1.1 |
The trend highlights a consistent relationship between stronger seasonal demand and declining listing duration. As Days-on-Market decreases, rental prices generally exhibit upward momentum.
Data-Driven Rental Intelligence
Vancouver rental market using days on market analytics allows housing professionals to identify patterns that may not be visible through pricing data alone. Listing duration frequently serves as an early indicator of changing demand conditions before substantial price movements occur.
Vacation Rental Listing Dataset solutions provide structured historical and real-time data that supports trend analysis, forecasting models, and performance benchmarking. These datasets are increasingly used by institutional investors, property managers, and housing technology companies.
The availability of large-scale rental datasets has transformed how market participants evaluate opportunities and assess risk. Continuous monitoring enables organizations to respond more effectively to market changes.
Geographic Demand Assessment
Analyzing rental listing performance across Metro Vancouver helps identify neighborhoods experiencing above-average tenant demand and stronger leasing efficiency. Areas near transit infrastructure, employment centers, universities, and commercial districts consistently demonstrate shorter listing durations.
Neighborhood-level analysis provides valuable insights for rental portfolio optimization. Investors can allocate resources more effectively by targeting markets with stronger occupancy trends and favorable pricing conditions.
Competitive Landscape Evaluation
Market Share Analysis allows property operators to understand how their inventory performs relative to competitors within specific geographic markets. Metrics such as active listing share, leasing conversion rates, occupancy performance, and average listing duration help evaluate competitive positioning.
Organizations that continuously benchmark their performance against local market averages are often better positioned to improve pricing strategies and maximize occupancy rates.
Monitoring Vacancy Signals
Scrape rental pricing trends and vacancy signals in Vancouver to obtain deeper visibility into market conditions and emerging demand shifts. Vacancy indicators often reveal changing market dynamics before they become visible through broader pricing statistics.
Rental intelligence platforms increasingly monitor listing removals, relisting activity, price reductions, incentives, and inventory changes. These indicators help identify neighborhoods experiencing strengthening or weakening demand conditions.
Emerging Applications of Rental Intelligence

Fare Fluctuation Alerts concepts originally developed for travel and airline industries are now being adapted for rental market monitoring. Automated alert systems notify landlords and analysts when significant pricing changes occur within selected markets.
These technologies support faster decision-making and help organizations react quickly to evolving rental conditions. Real-time notifications reduce response times and improve pricing accuracy.
Strategic Recommendations
Rental market participants should prioritize continuous monitoring of listing duration, pricing performance, vacancy trends, and neighborhood demand indicators. Organizations that combine Days-on-Market analysis with pricing intelligence are often able to achieve higher occupancy levels and stronger rental yields.
Data-driven decision-making enables property managers to optimize lease performance while reducing vacancy exposure. As rental markets become increasingly competitive, advanced analytics will continue to play a central role in operational success.
Conclusion
The Vancouver rental market continues to evolve as demographic growth, housing supply constraints, and economic conditions influence tenant behavior. Days-on-Market remains one of the most effective indicators for evaluating rental demand and leasing efficiency.
Vancouver rental market forecasting for listing duration and pricing data is becoming increasingly important for investors, landlords, and property management firms seeking long-term strategic advantages.
Tracking Vancouver rental demand through days on market metrics provides deeper visibility into market performance and helps identify emerging opportunities before broader market changes occur.
Real-Time Price Intelligence enables organizations to respond rapidly to market developments, improve pricing accuracy, reduce vacancy periods, and strengthen overall portfolio performance across Metro Vancouver.
Ready to elevate your travel business with cutting-edge data insights? Scrape Aggregated Flight Fares to identify competitive rates and optimize your revenue strategies efficiently. Discover emerging opportunities with tools to Extract Travel Website Data, leveraging comprehensive data to forecast market shifts and enhance your service offerings. Real-Time Travel App Data Scraping Services helps stay ahead of competitors, gaining instant insights into bookings, promotions, and customer behavior across multiple platforms. Get in touch with Travel Scrape today to explore how our end-to-end data solutions can uncover new revenue streams, enhance your offerings, and strengthen your competitive edge in the travel market.
Unlock the Full Report
Enter your details to access premium pricing intelligence insights