Scrape Home2Suites Hotel Chains Location Data in USA 2026 for Advanced Hospitality Analytics
This report provides comprehensive insights into Home2Suites hotel locations, covering distribution, pricing, occupancy trends, and data-driven strategies for smarter decision-making across the USA hospitality market.

Introduction
The hospitality industry continues to witness rapid growth in data-driven decision-making, particularly within the extended-stay segment. One of the key drivers for strategic planning in this space is the ability to Scrape Home2Suites Hotel Chains location data in USA, enabling organizations to gain comprehensive insights into hotel distribution, occupancy trends, pricing strategies, and guest experiences. By leveraging advanced technologies such as the Home2 Suites By Hilton Hotel Location Dataset, businesses can unlock structured intelligence for expansion planning and performance optimization.
Furthermore, implementing Home2Suites location data scraping USA methodologies allows analysts to build real-time pipelines that capture dynamic hotel information, including availability, seasonal pricing, and customer sentiment. With over 600+ properties across the United States, Home2 Suites by Hilton has established a strong presence in business hubs and travel corridors. This makes Hotel Chains Data Scraping essential for organizations seeking to understand market demand, benchmark competitors, and enhance decision-making across the hospitality ecosystem. Below mentioned states represent high-demand markets where businesses can Scrape Hotel Chains Location Data to uncover regional trends and optimize market entry strategies.
600+
Hotels
45+
States Covered
300+
Cities
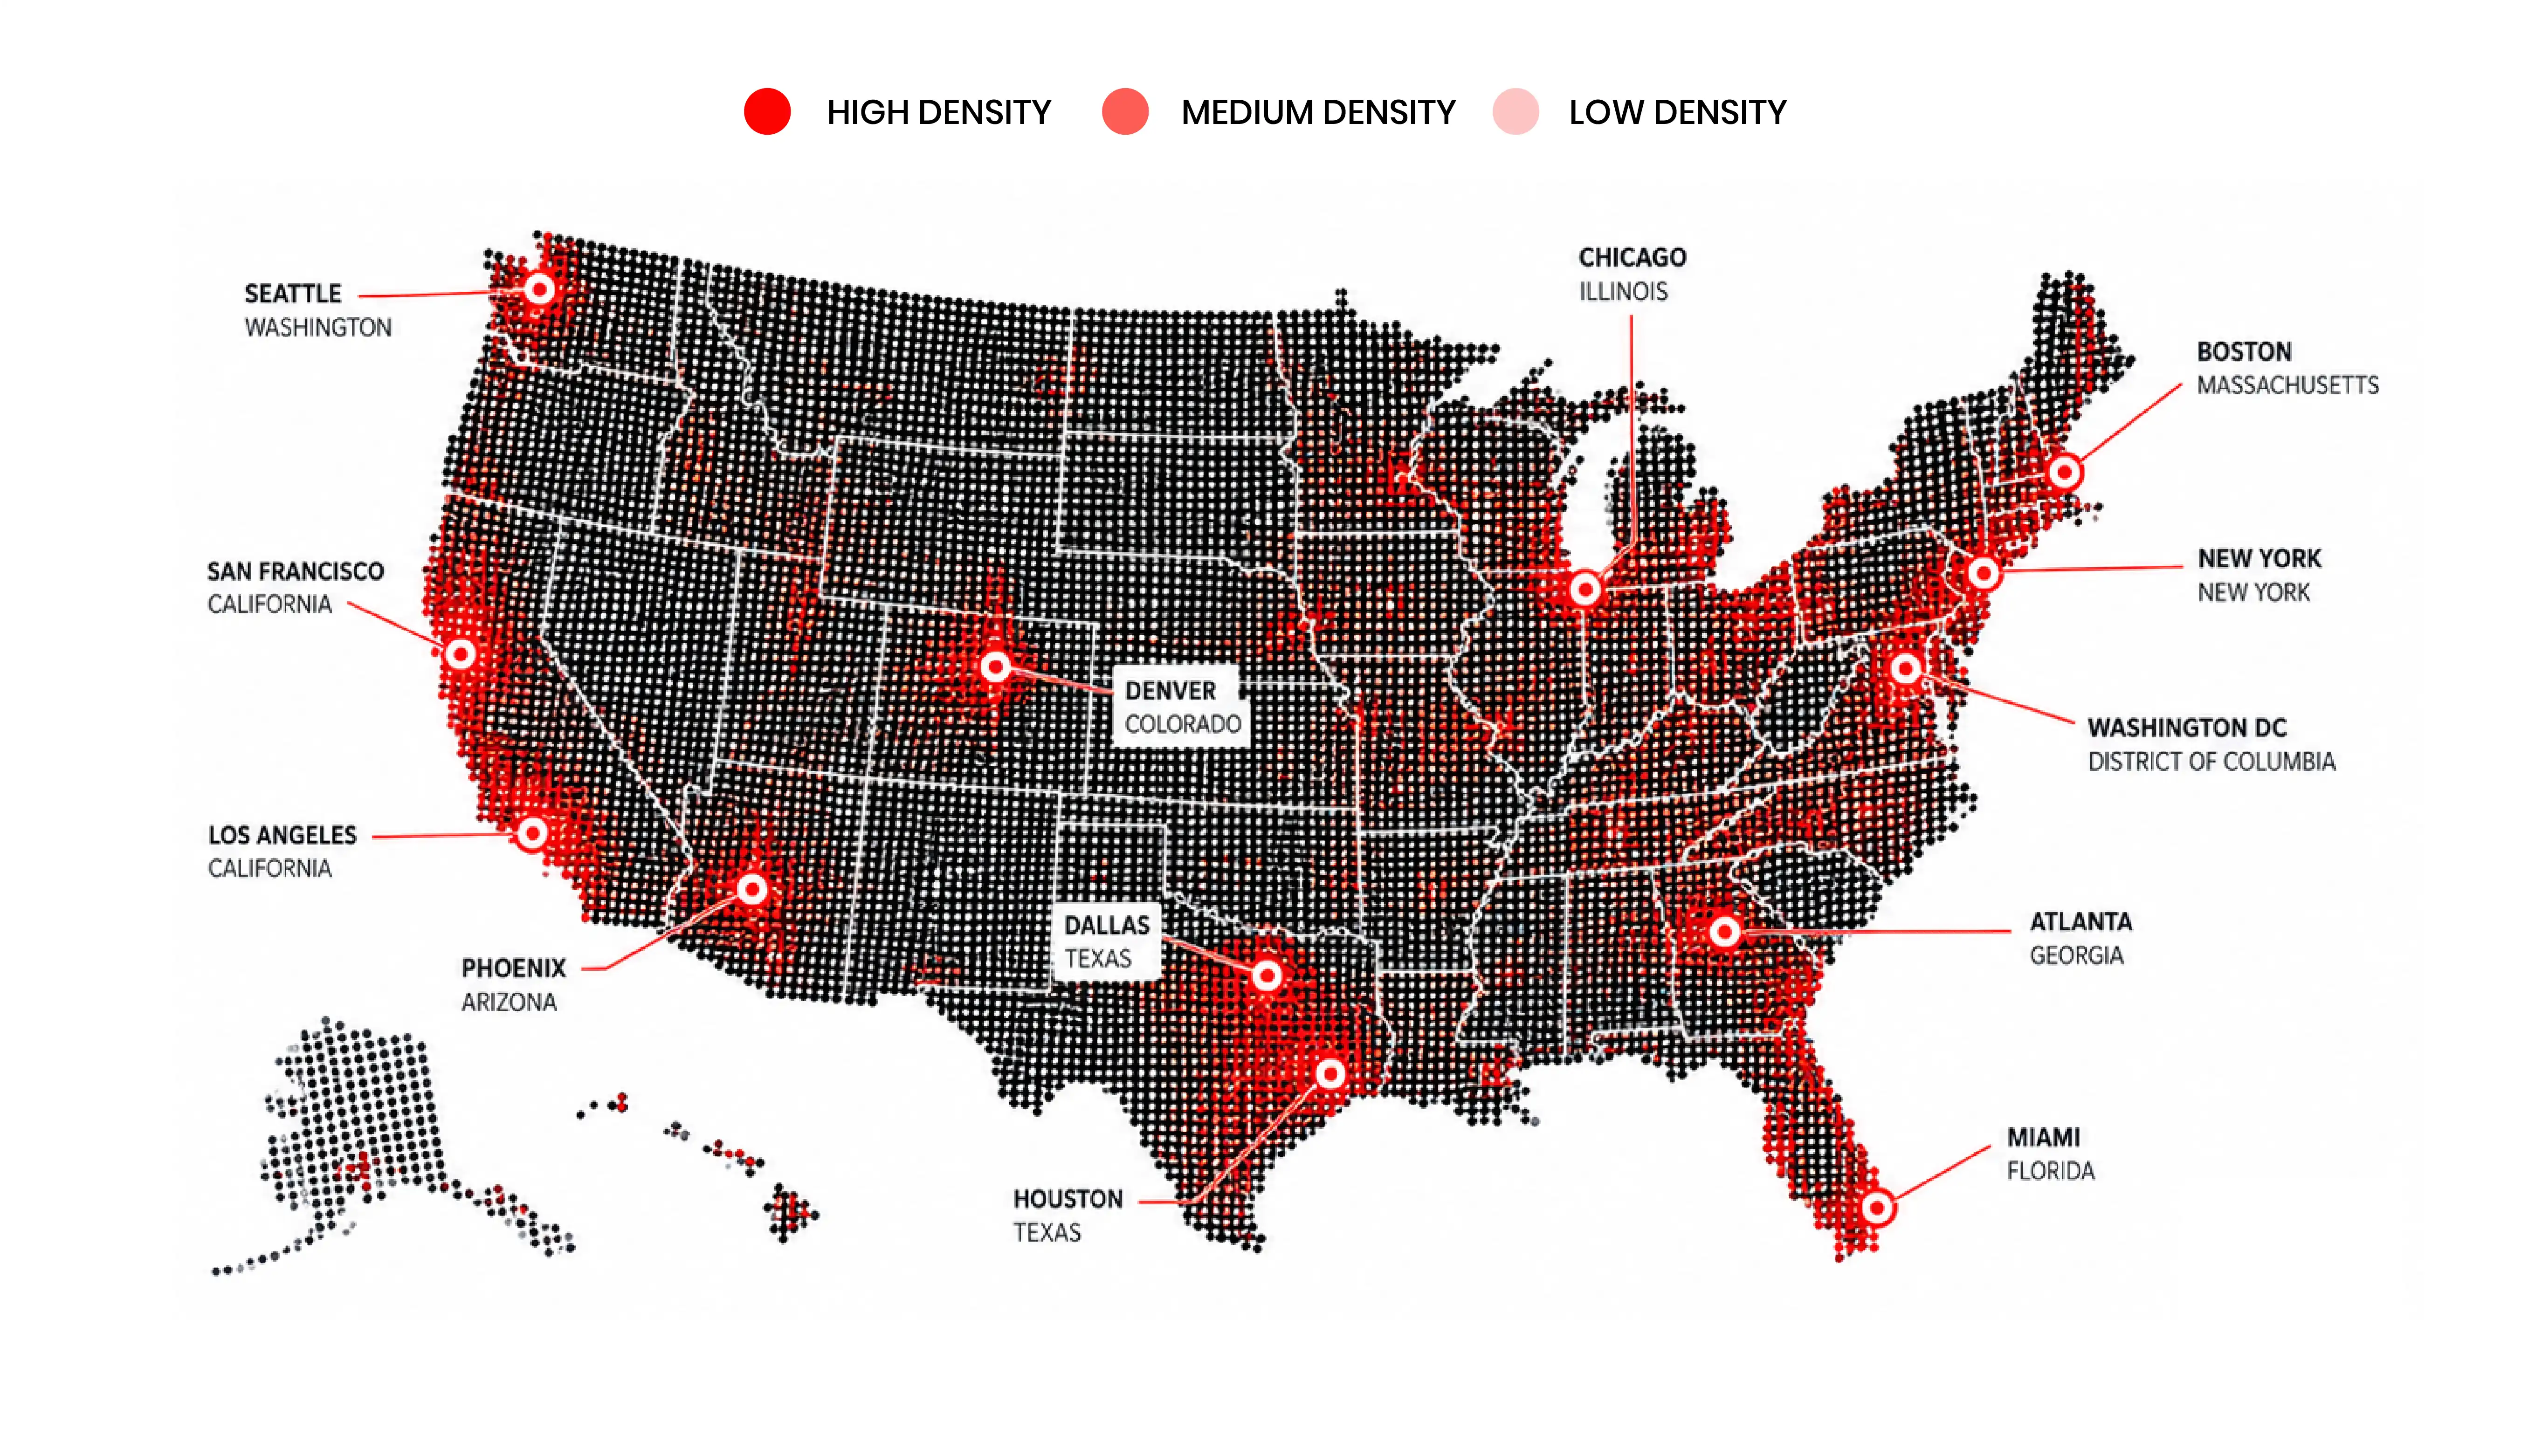
Top States by Number of Home2Suites Hotels
States with the highest number of Home2 Suites properties across the USA highlight strong regional demand patterns and growth opportunities. The Home2Suites USA Hotel locations dataset provides valuable insights into geographic concentration and expansion strategies.
TEXAS
95+
FLORIDA
80+
CALIFORNIA
75+
GEORGIA
60+
NORTH CAROLINA
55+
ARIZONA
40+
City Level Granularity
Total Cities Covered: 300+ major and mid-sized cities including Houston, Dallas, Atlanta, Orlando, Phoenix, Charlotte, and more.
High Occupancy Hubs :
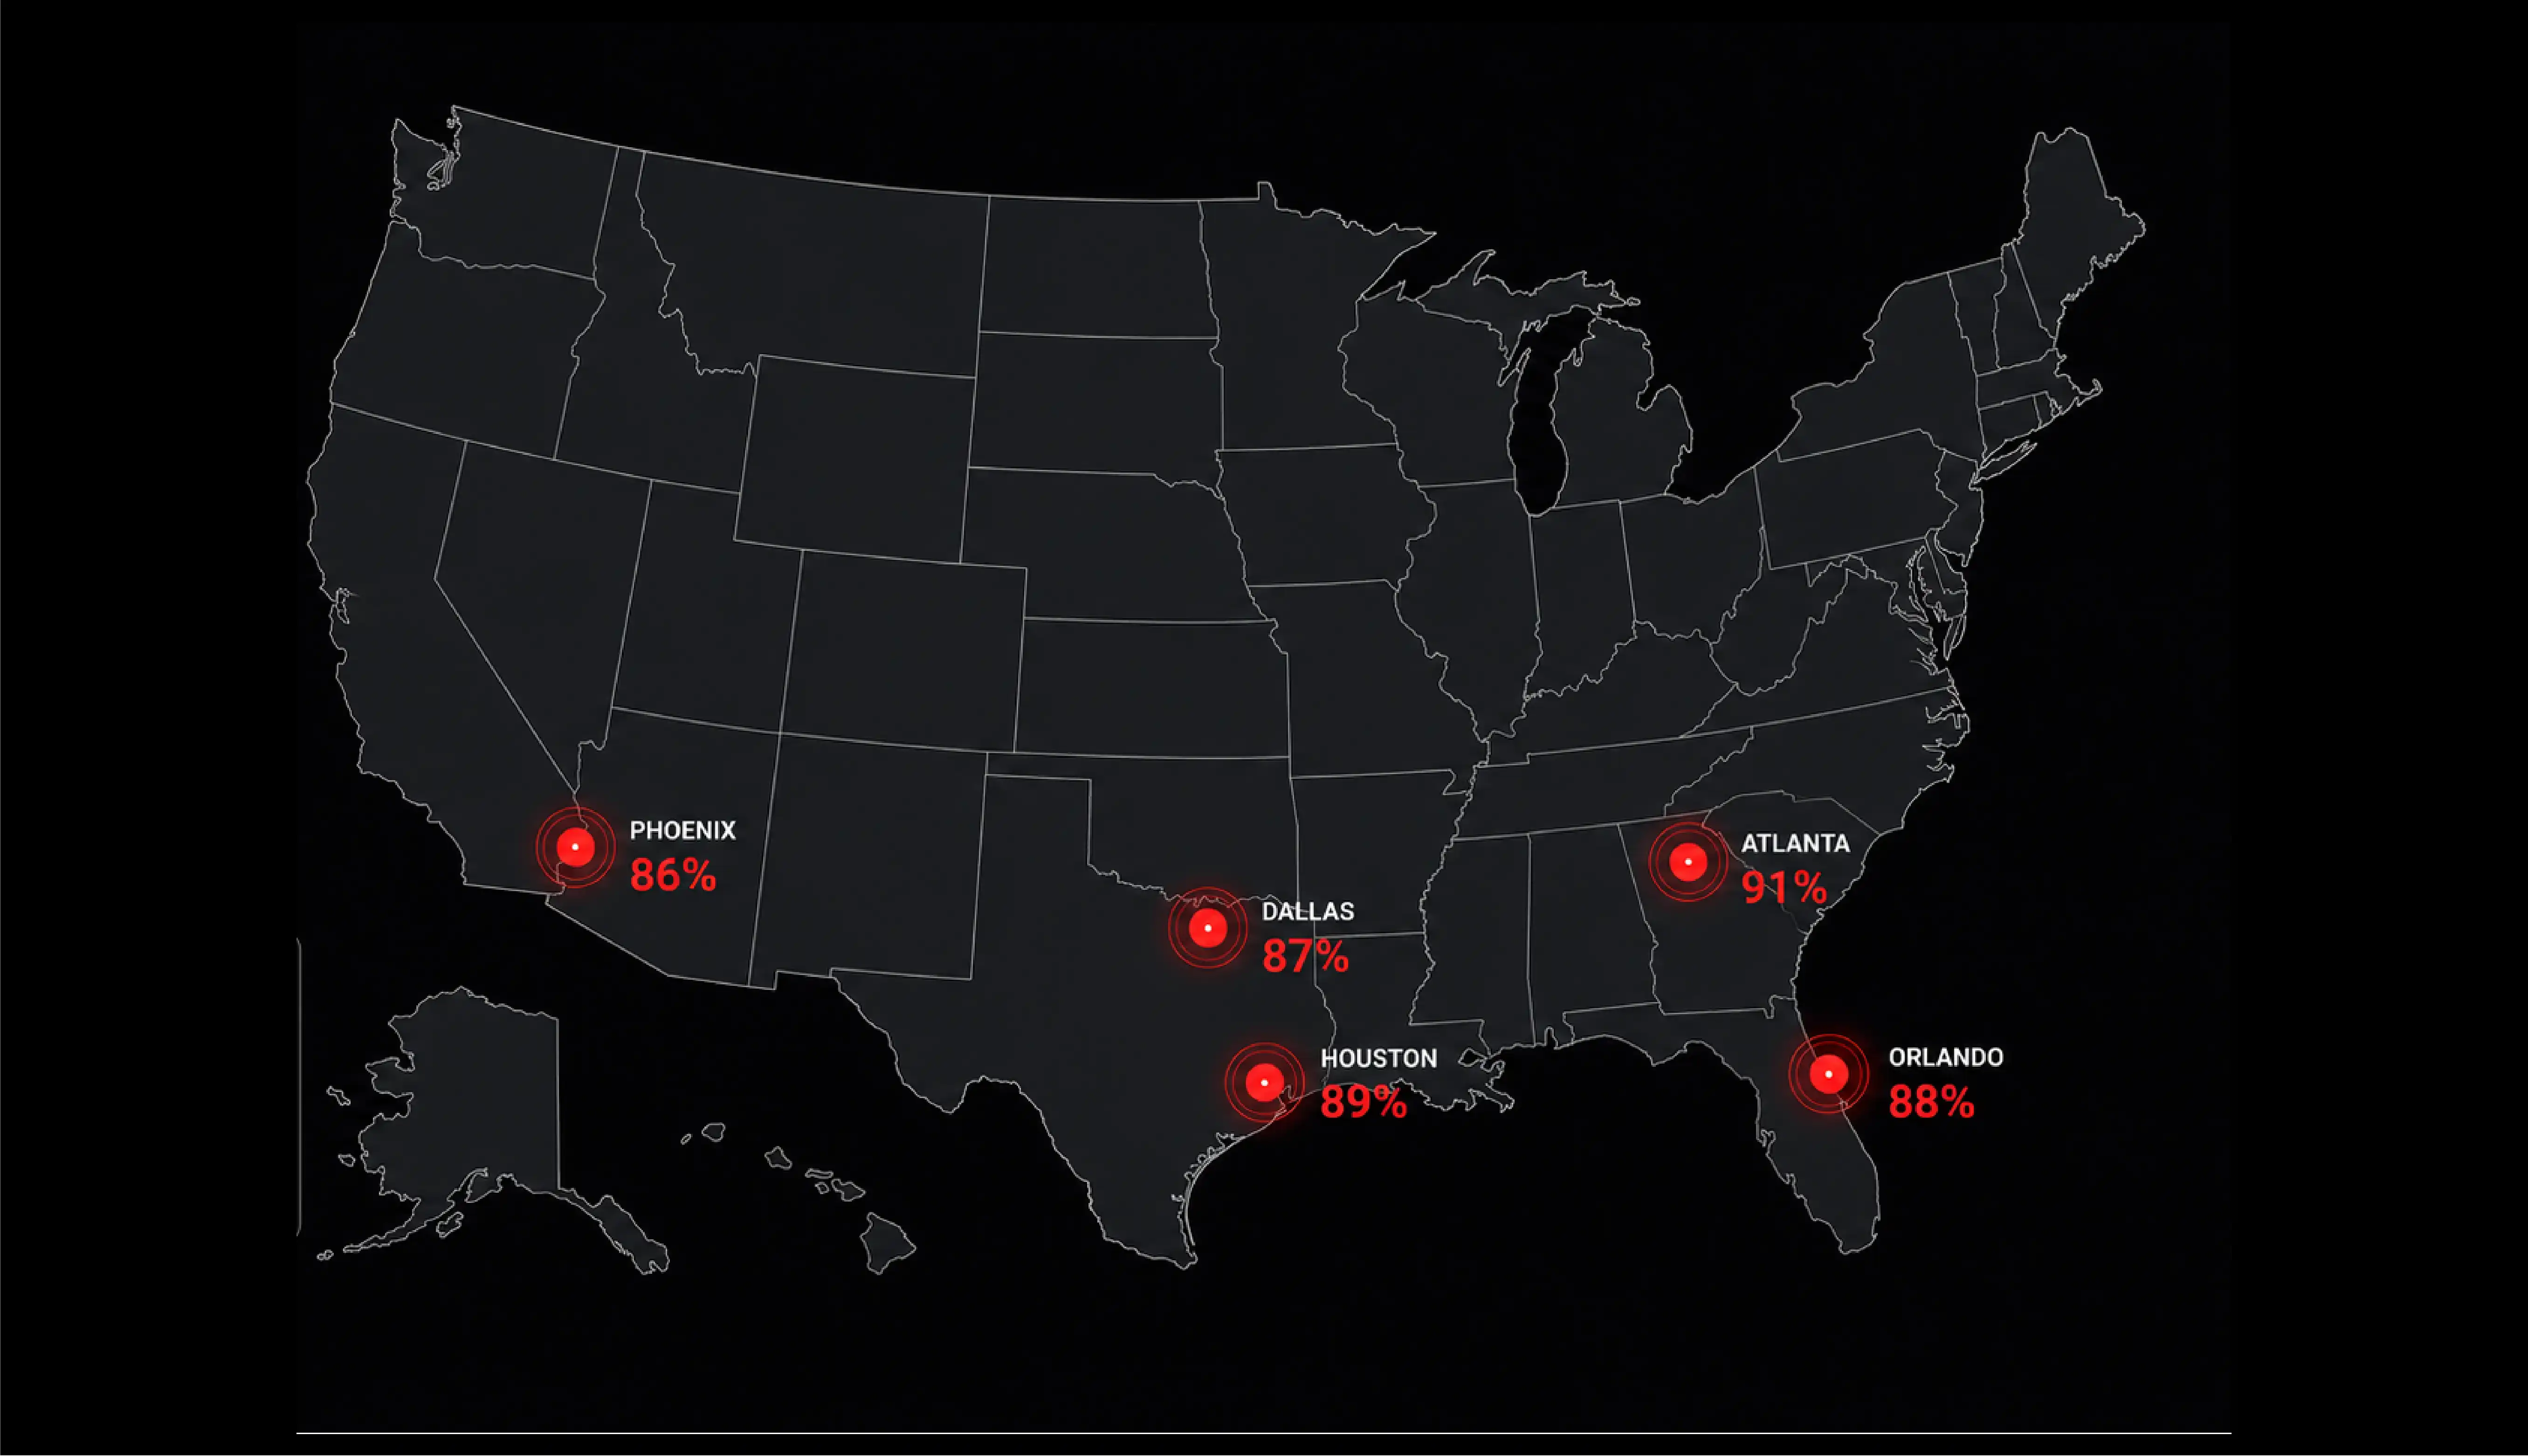
Top States with Most Home2Suites Hotels in the USA
Based on available data, the states with the highest number of Home2 Suites properties include:
| Rank | State Name | Total Hotels | Key Cities |
|---|---|---|---|
| 01 | Texas | 95+ | Houston, Dallas, Austin, San Antonio |
| 02 | Florida | 80+ | Orlando, Miami, Tampa, Jacksonville |
| 03 | California | 75+ | Los Angeles, San Diego, San Jose |
| 04 | Georgia | 60+ | Atlanta, Savannah |
| 05 | North Carolina | 55+ | Charlotte, Raleigh |
| 06 | Arizona | 40+ | Phoenix, Tucson |
These regions not only host a majority of properties but also reflect how API-driven solutions like the Home2Suites location data Scraping API USA help track expansion, pricing, and occupancy patterns in real time. This dataset is highly beneficial for businesses conducting Property Listing Analysis to identify high-performing markets.
Home2Suites Hotels in Key US Cities
| Rank | City Name | Hotels | Avg Review | Star Rating | Starting Price |
|---|---|---|---|---|---|
| 01 | Houston | 18 | 8.3 | 3★–4★ | $140 |
| 02 | Dallas | 16 | 8.2 | 3★–4★ | $135 |
| 03 | Atlanta | 15 | 8.4 | 3★–4★ | $145 |
| 04 | Orlando | 14 | 8.1 | 3★–4★ | $150 |
| 05 | Phoenix | 12 | 8.0 | 3★–4★ | $130 |
This table highlights cities with strong Home2 Suites presence and customer satisfaction scores. Analysts can leverage Home2Suites Hotel Chains Location Data Intelligence to benchmark performance and optimize pricing strategies across regions.
Home2Suites Hotels with High Occupancy Rates
| Rank | Hotel Name | City | Star Rating | Review Score | Total Rooms | Occupancy Rate (%) |
|---|---|---|---|---|---|---|
| 01 | Home2 Suites Houston Medical Center | Houston | 4★ | 8.5 | 150 | 93% |
| 02 | Home2 Suites Atlanta Downtown | Atlanta | 4★ | 8.6 | 140 | 92% |
| 03 | Home2 Suites Orlando Airport | Orlando | 4★ | 8.4 | 160 | 90% |
| 04 | Home2 Suites Dallas Downtown | Dallas | 4★ | 8.3 | 145 | 89% |
Hotels with high occupancy rates demonstrate how structured Hotel Data Intelligence can guide pricing optimization, demand forecasting, and operational efficiency improvements.
Distribution of Home2Suites Hotels Across Major US Cities
| Rank | City | Number of Hotels | Total Rooms | Avg Review Score | Starting Price (USD) |
|---|---|---|---|---|---|
| 01 | Houston | 18 | 2,400 | 8.3 | 140 |
| 02 | Atlanta | 15 | 2,100 | 8.4 | 145 |
| 03 | Dallas | 16 | 2,200 | 8.2 | 135 |
| 04 | Orlando | 14 | 1,900 | 8.1 | 150 |
| 05 | Phoenix | 12 | 1,600 | 8.0 | 130 |
This table provides a clear overview of Home2 Suites’ city-level footprint in the USA, supporting detailed analysis for hospitality planners and investors.
Ready to Elevate Your Hospitality Strategy?
“Unlock the power of Home2 Suites hotel location intelligence to enhance decision-making, refine pricing models, and identify high-growth opportunities across the U.S. hospitality landscape.”
Advantages of Home2Suites Hotel Location Data Over Generic Hotel Datasets
Our Home2 Suites-focused datasets provide actionable intelligence designed to support smarter planning, stronger positioning, and data-driven growth across the hospitality ecosystem. By utilizing structured and continuously updated information, organizations can uncover deeper insights into performance, demand, and regional opportunities. Key benefits include:
- Revenue Management Teams: Helps optimize pricing strategies by analyzing demand fluctuations, occupancy trends, and seasonal booking patterns across locations.
- Market Research & Analytics Firms: Enables detailed study of regional performance, customer preferences, and brand penetration to support strategic reporting and forecasting.
- Franchise Development & Expansion Teams: Assists in identifying high-potential territories and evaluating feasibility for new property development based on demand indicators.
- Digital Travel Aggregators & OTAs: Improves listing accuracy, enhances search relevance, and supports dynamic pricing models to drive better customer engagement and bookings.
| Fields Name | Description |
|---|---|
| Property Identifier | Unique name and brand classification of each Home2 Suites location |
| Geographic Information | Detailed address, city, state, zip code, and geo-coordinates for mapping analysis |
| Inventory Metrics | Total suite count, room types, and availability status across time periods |
| Rate Intelligence | Dynamic pricing data, weekday vs weekend rates, and seasonal price fluctuations |
| Customer Experience Data | Aggregated ratings, review volume, sentiment analysis, and feedback trends |
Insights and Analysis
Strategic Corridor Placement
Home2 Suites properties are frequently positioned along commercial corridors, airports, and interstate routes to capture consistent traveler demand and ensure high visibility.
Demand-Driven Brand Positioning
The brand aligns its offerings with extended-stay guests, including business travelers and relocating families, ensuring steady occupancy through flexible stay options.
Dynamic Yield Management
Advanced analytics enable real-time rate adjustments based on booking pace, local demand surges, and seasonal travel patterns to maximize revenue.
Data-Led Competitive Mapping
Structured datasets allow businesses to identify gaps in competitor coverage, uncover whitespace opportunities, and refine expansion strategies effectively.
Experience-Centric Improvements
Continuous analysis of guest sentiment and service feedback helps enhance amenities, optimize operations, and strengthen overall customer satisfaction.
Conclusion
By leveraging advanced analytics to extract Home2 Suites hotel chain data, businesses can gain deep insights into distribution, occupancy, and pricing trends across the United States. These insights become even more powerful when combined with USA hotel chain market share data scraping for Home2Suites, enabling organizations to understand brand positioning at a national level.
Additionally, Home2Suites hotel chain competitor benchmarking USA supports comparative analysis against other extended-stay brands, helping stakeholders refine their strategies. Continuous tracking through New Entrant Monitoring further ensures that businesses stay ahead of emerging competitors and evolving market dynamics, ultimately strengthening their position in the U.S. hospitality industry.