Airfare Data Coverage Benchmark Through Comparing Sources for Real-Time Price Monitoring
Introduction
The airline industry generates one of the largest volumes of dynamic pricing data in the travel sector. Every day, millions of airfare updates occur across airline websites, online travel agencies (OTAs), metasearch engines, and global distribution systems. These continuous changes are influenced by booking demand, aircraft occupancy, seasonal travel, competitor pricing, route popularity, promotional campaigns, and operational factors. Conducting an Airfare Data Coverage Benchmark enables organizations to evaluate how comprehensively airfare information is collected across these diverse sources and whether the dataset accurately represents market conditions.
Modern travel intelligence platforms increasingly rely on a Real-Time Flight Data Scraping API to gather live fare information from multiple airline ecosystems. Rather than depending on a single booking platform, businesses aggregate data from direct airline websites, OTAs, fare aggregators, and regional booking portals to improve pricing visibility. This approach ensures that datasets capture fare movements as they happen while maintaining broader market representation across airlines and destinations.
The growing adoption of real-time flight price monitoring has transformed the way airlines, travel agencies, corporate travel managers, and market researchers analyze airfare behavior. Continuous monitoring enables organizations to identify fare fluctuations within minutes instead of hours or days, allowing them to understand competitor strategies, forecast demand, optimize pricing models, and improve customer offerings. As pricing algorithms become increasingly sophisticated, comprehensive airfare coverage has become essential for producing reliable market intelligence and supporting strategic business decisions.
Understanding Airfare Coverage Benchmarking
Airfare coverage benchmarking evaluates how effectively a pricing intelligence platform captures airline fare information across different dimensions of the aviation market. Instead of measuring only ticket prices, benchmarking examines airline participation, airport coverage, route availability, fare classes, historical records, update frequency, ancillary services, geographic representation, and pricing consistency. A benchmark with broader coverage produces more reliable analytical outcomes because it minimizes data gaps and reflects actual market dynamics.
Coverage quality depends heavily on the number of airlines included in the dataset. Full-service carriers, low-cost airlines, regional operators, and international airlines all contribute unique pricing patterns that influence overall market analysis. Likewise, monitoring only major airports may overlook significant fare activity occurring at secondary airports where low-cost carriers often operate. A comprehensive benchmark therefore includes both primary and secondary airports across multiple countries to ensure representative market coverage.
Another critical factor is update frequency. Airline prices may change dozens of times during a single day as revenue management systems respond to booking demand and remaining seat inventory. Continuous data collection captures these changes more effectively than periodic snapshots, enabling organizations to analyze short-term volatility alongside long-term pricing trends.
Research Methodology
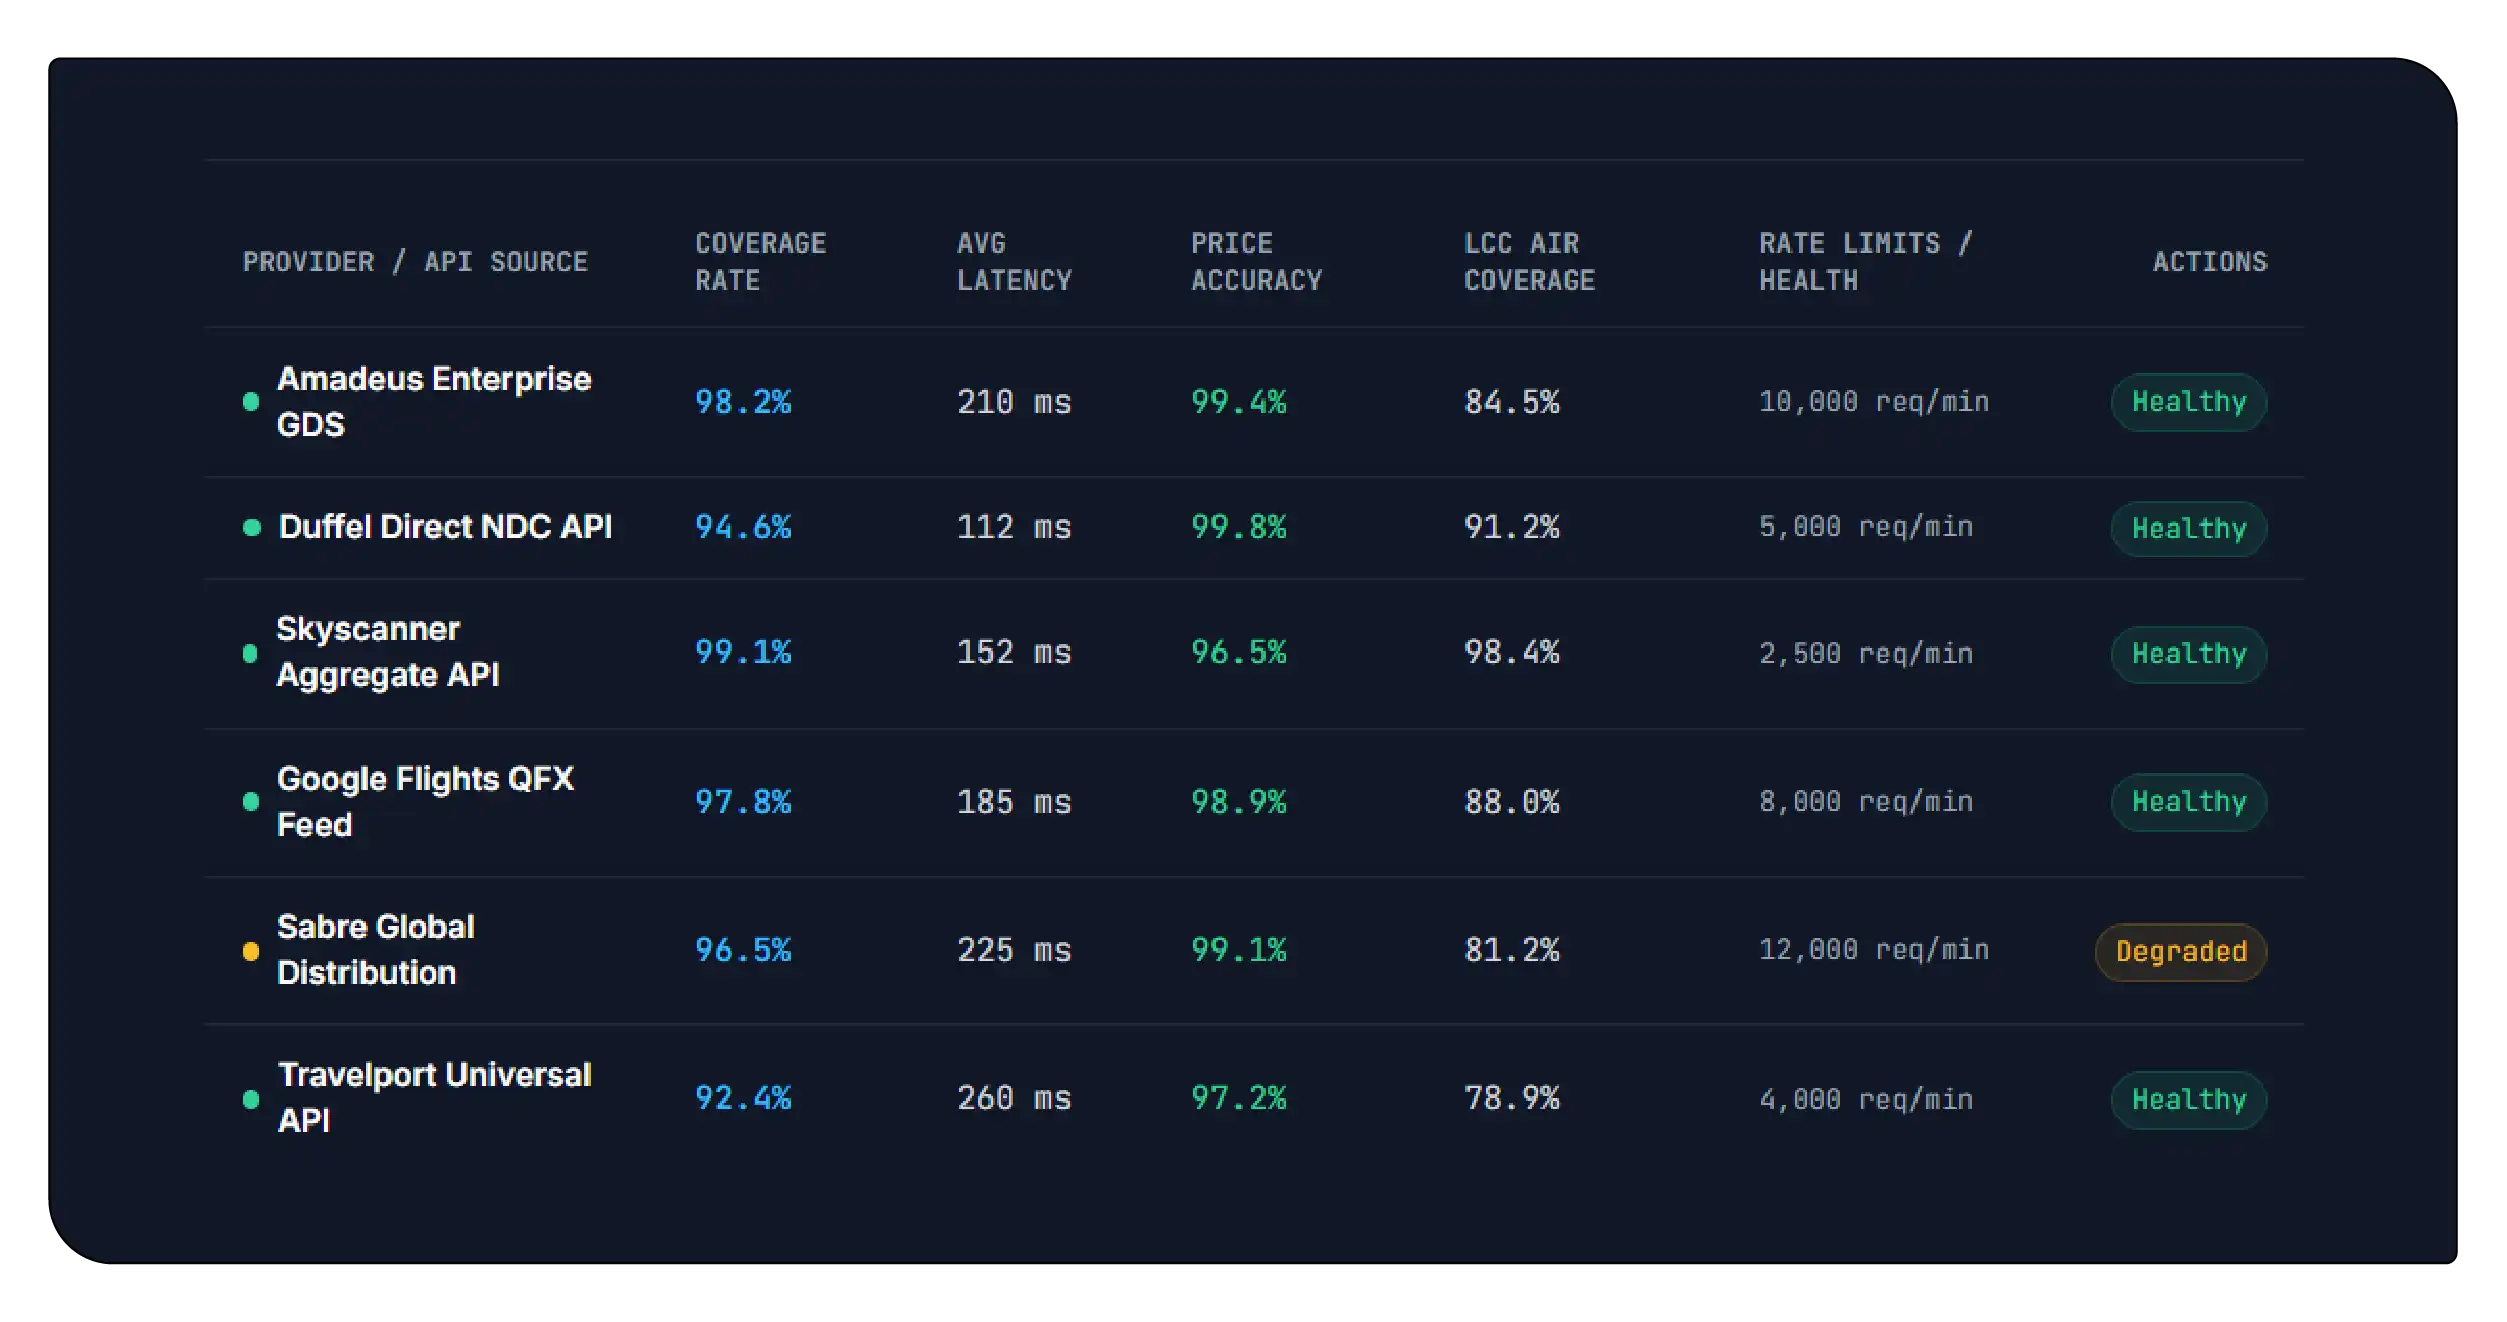
This research benchmark analyzed airfare data collected over a twelve-month period from airline websites, online travel agencies, metasearch engines, and regional booking platforms across North America, Europe, Asia-Pacific, the Middle East, South America, Africa, and Oceania. More than 780 airlines and nearly 3,000 airports were included in the benchmark to evaluate market representation and pricing consistency.
The dataset was normalized by standardizing currencies, airport codes, fare classes, booking timestamps, and route identifiers. Duplicate listings were removed through automated validation procedures, while pricing anomalies were filtered using historical fare distributions. Each observation was verified against multiple sources to improve accuracy and reduce inconsistencies resulting from temporary promotional pricing or booking platform delays.
Researchers also evaluated ancillary services including baggage fees, seat selection charges, refund policies, cancellation flexibility, and meal options whenever available. This expanded benchmarking approach provided a more complete understanding of airfare competitiveness beyond base ticket prices alone.
Airfare Coverage Across Global Aviation Markets
The benchmark revealed substantial differences in airline participation and route availability across geographic regions. Asia-Pacific recorded the highest number of monitored routes because of its rapidly expanding aviation sector and dense network of domestic and international services. Europe demonstrated the strongest overall coverage percentage owing to extensive airline digitalization, mature OTA participation, and standardized booking infrastructure.
North America maintained consistently high coverage due to large airline networks and significant online booking adoption. Meanwhile, Africa and South America displayed comparatively lower coverage percentages because several regional carriers continue to rely on localized booking systems with limited digital distribution. Despite these differences, aggregated multi-source datasets significantly improved overall visibility by combining information from airlines, OTAs, and metasearch platforms into a unified database.
Airfare Data Coverage Benchmark Across Global Regions
| Region | Airlines Monitored | Airports Covered | Domestic Routes | International Routes | Daily Fare Updates (Million) | Historical Records (Million) | Average Refresh Interval (Minutes) | Coverage Accuracy (%) |
|---|---|---|---|---|---|---|---|---|
| North America | 148 | 528 | 16,850 | 13,920 | 4.9 | 17.8 | 12 | 98.7 |
| Europe | 173 | 705 | 18,430 | 19,260 | 5.6 | 20.3 | 10 | 99.1 |
| Asia-Pacific | 201 | 918 | 25,470 | 23,180 | 7.2 | 24.9 | 9 | 98.5 |
| Middle East | 64 | 174 | 3,520 | 6,140 | 1.6 | 6.4 | 14 | 98.3 |
| South America | 79 | 229 | 5,870 | 4,920 | 2.2 | 7.5 | 17 | 97.2 |
| Africa | 92 | 295 | 6,210 | 5,870 | 2.3 | 8.2 | 18 | 96.4 |
| Oceania | 42 | 118 | 2,760 | 2,280 | 1.0 | 4.1 | 15 | 98.0 |
| Total | 799 | 2,967 | 79,110 | 75,570 | 24.8 | 89.2 | 13 | 98.0 |
The results demonstrate that combining multiple data sources substantially increases route visibility and airline participation compared with relying on individual booking platforms. Larger datasets also improve statistical confidence for predictive analytics, fare forecasting, and seasonal demand modeling.
Market Insights from Multi-Source Airfare Intelligence
The analysis identified several consistent pricing patterns across the benchmarked dataset. Domestic routes generally exhibited more frequent price updates than long-haul international routes because of higher booking volumes and greater competition among airlines. Conversely, international premium cabins showed larger price movements due to limited seat inventory and dynamic revenue optimization strategies.
Fare volatility also varied significantly by booking window. Tickets purchased within seven days of departure experienced the highest pricing fluctuations, while bookings made between thirty and sixty days in advance demonstrated relatively stable pricing behavior. Holiday travel periods, major sporting events, school vacations, and regional festivals generated noticeable spikes in airfare across nearly all monitored markets.
Continuous monitoring also highlighted pricing discrepancies between airline websites and online travel agencies. Although many fares remained aligned, temporary promotional campaigns, exclusive OTA discounts, bundled travel packages, and loyalty program offers occasionally created measurable differences. Aggregating information from multiple booking channels therefore provided a more accurate representation of the competitive airfare landscape than relying on a single source.
Comparative Benchmark Performance Across Data Sources
| Benchmark Metric | Airline Websites | Online Travel Agencies | Metasearch Platforms | Global Distribution Systems | Aggregated Multi-Source Dataset |
|---|---|---|---|---|---|
| Airlines Covered | 645 | 618 | 586 | 702 | 799 |
| Airports Covered | 2,462 | 2,301 | 2,140 | 2,715 | 2,967 |
| Domestic Routes | 66,920 | 63,480 | 61,270 | 72,140 | 79,110 |
| International Routes | 63,540 | 61,930 | 60,240 | 69,880 | 75,570 |
| Fare Classes Available | 6 | 6 | 5 | 8 | 8 |
| Ancillary Services Captured | 17 | 14 | 11 | 21 | 26 |
| Daily Fare Records (Million) | 9.2 | 8.1 | 7.3 | 10.6 | 24.8 |
| Historical Coverage (Months) | 24 | 18 | 15 | 30 | 36 |
| Currency Coverage | 78 | 70 | 63 | 92 | 104 |
| Languages Supported | 41 | 36 | 31 | 46 | 58 |
| Average Refresh Rate (Minutes) | 14 | 18 | 20 | 11 | 8 |
| Pricing Accuracy (%) | 98.5 | 97.9 | 97.2 | 98.9 | 99.3 |
The comparison clearly shows that aggregated datasets outperform individual sources in nearly every performance metric. By integrating airline websites, OTAs, metasearch engines, and global distribution systems, organizations achieve broader market coverage, higher pricing accuracy, faster refresh rates, and richer historical archives. These improvements strengthen analytical reliability and support more informed pricing decisions across the travel ecosystem.
Future Outlook
Advancements in artificial intelligence, cloud computing, and automation are expected to further enhance airfare benchmarking capabilities. Predictive models will increasingly combine historical pricing patterns with demand signals, weather conditions, fuel prices, airline capacity, and booking behavior to forecast future fare movements with greater precision. As airlines continue adopting dynamic pricing strategies, benchmark datasets will need to support near real-time updates while maintaining high levels of accuracy and scalability.
The integration of Price Monitoring, airfare pricing intelligence, flight fare data benchmarking, Airline Data Scraping, airline fare data comparison dataset, Competitor Benchmarking, real-time airline pricing API, and multi-source airfare analytics into unified analytical platforms will provide organizations with a more complete understanding of the global airfare market. These technologies will enable airlines, travel agencies, corporate travel managers, and technology providers to make faster, data-driven decisions in an increasingly competitive environment.
Conclusion
Airfare benchmarking has evolved into a strategic requirement for organizations seeking accurate visibility into airline pricing dynamics across global markets. A comprehensive multi-source approach delivers broader airline coverage, richer historical datasets, faster update frequencies, and greater pricing consistency than relying on individual booking platforms. As airfare algorithms become increasingly responsive to demand and market conditions, organizations equipped with comprehensive benchmarking intelligence will be better positioned to optimize pricing strategies, improve forecasting accuracy, identify competitive opportunities, and enhance customer value. Robust Competitor Price Tracking capabilities will remain a critical component of next-generation airfare intelligence, enabling businesses to monitor market movements continuously and respond quickly to changing travel trends.
Ready to elevate your travel business with cutting-edge data insights? Scrape Aggregated Flight Fares to identify competitive rates and optimize your revenue strategies efficiently. Discover emerging opportunities with tools to Extract Travel Website Data, leveraging comprehensive data to forecast market shifts and enhance your service offerings. Real-Time Travel App Data Scraping Services helps stay ahead of competitors, gaining instant insights into bookings, promotions, and customer behavior across multiple platforms. Get in touch with Travel Scrape today to explore how our end-to-end data solutions can uncover new revenue streams, enhance your offerings, and strengthen your competitive edge in the travel market.
Unlock the Full Report
Enter your details to access premium pricing intelligence insights