Daily Ride-Hailing Fare Comparison Data Scraping for Uber, Ola & Rapido
Introduction
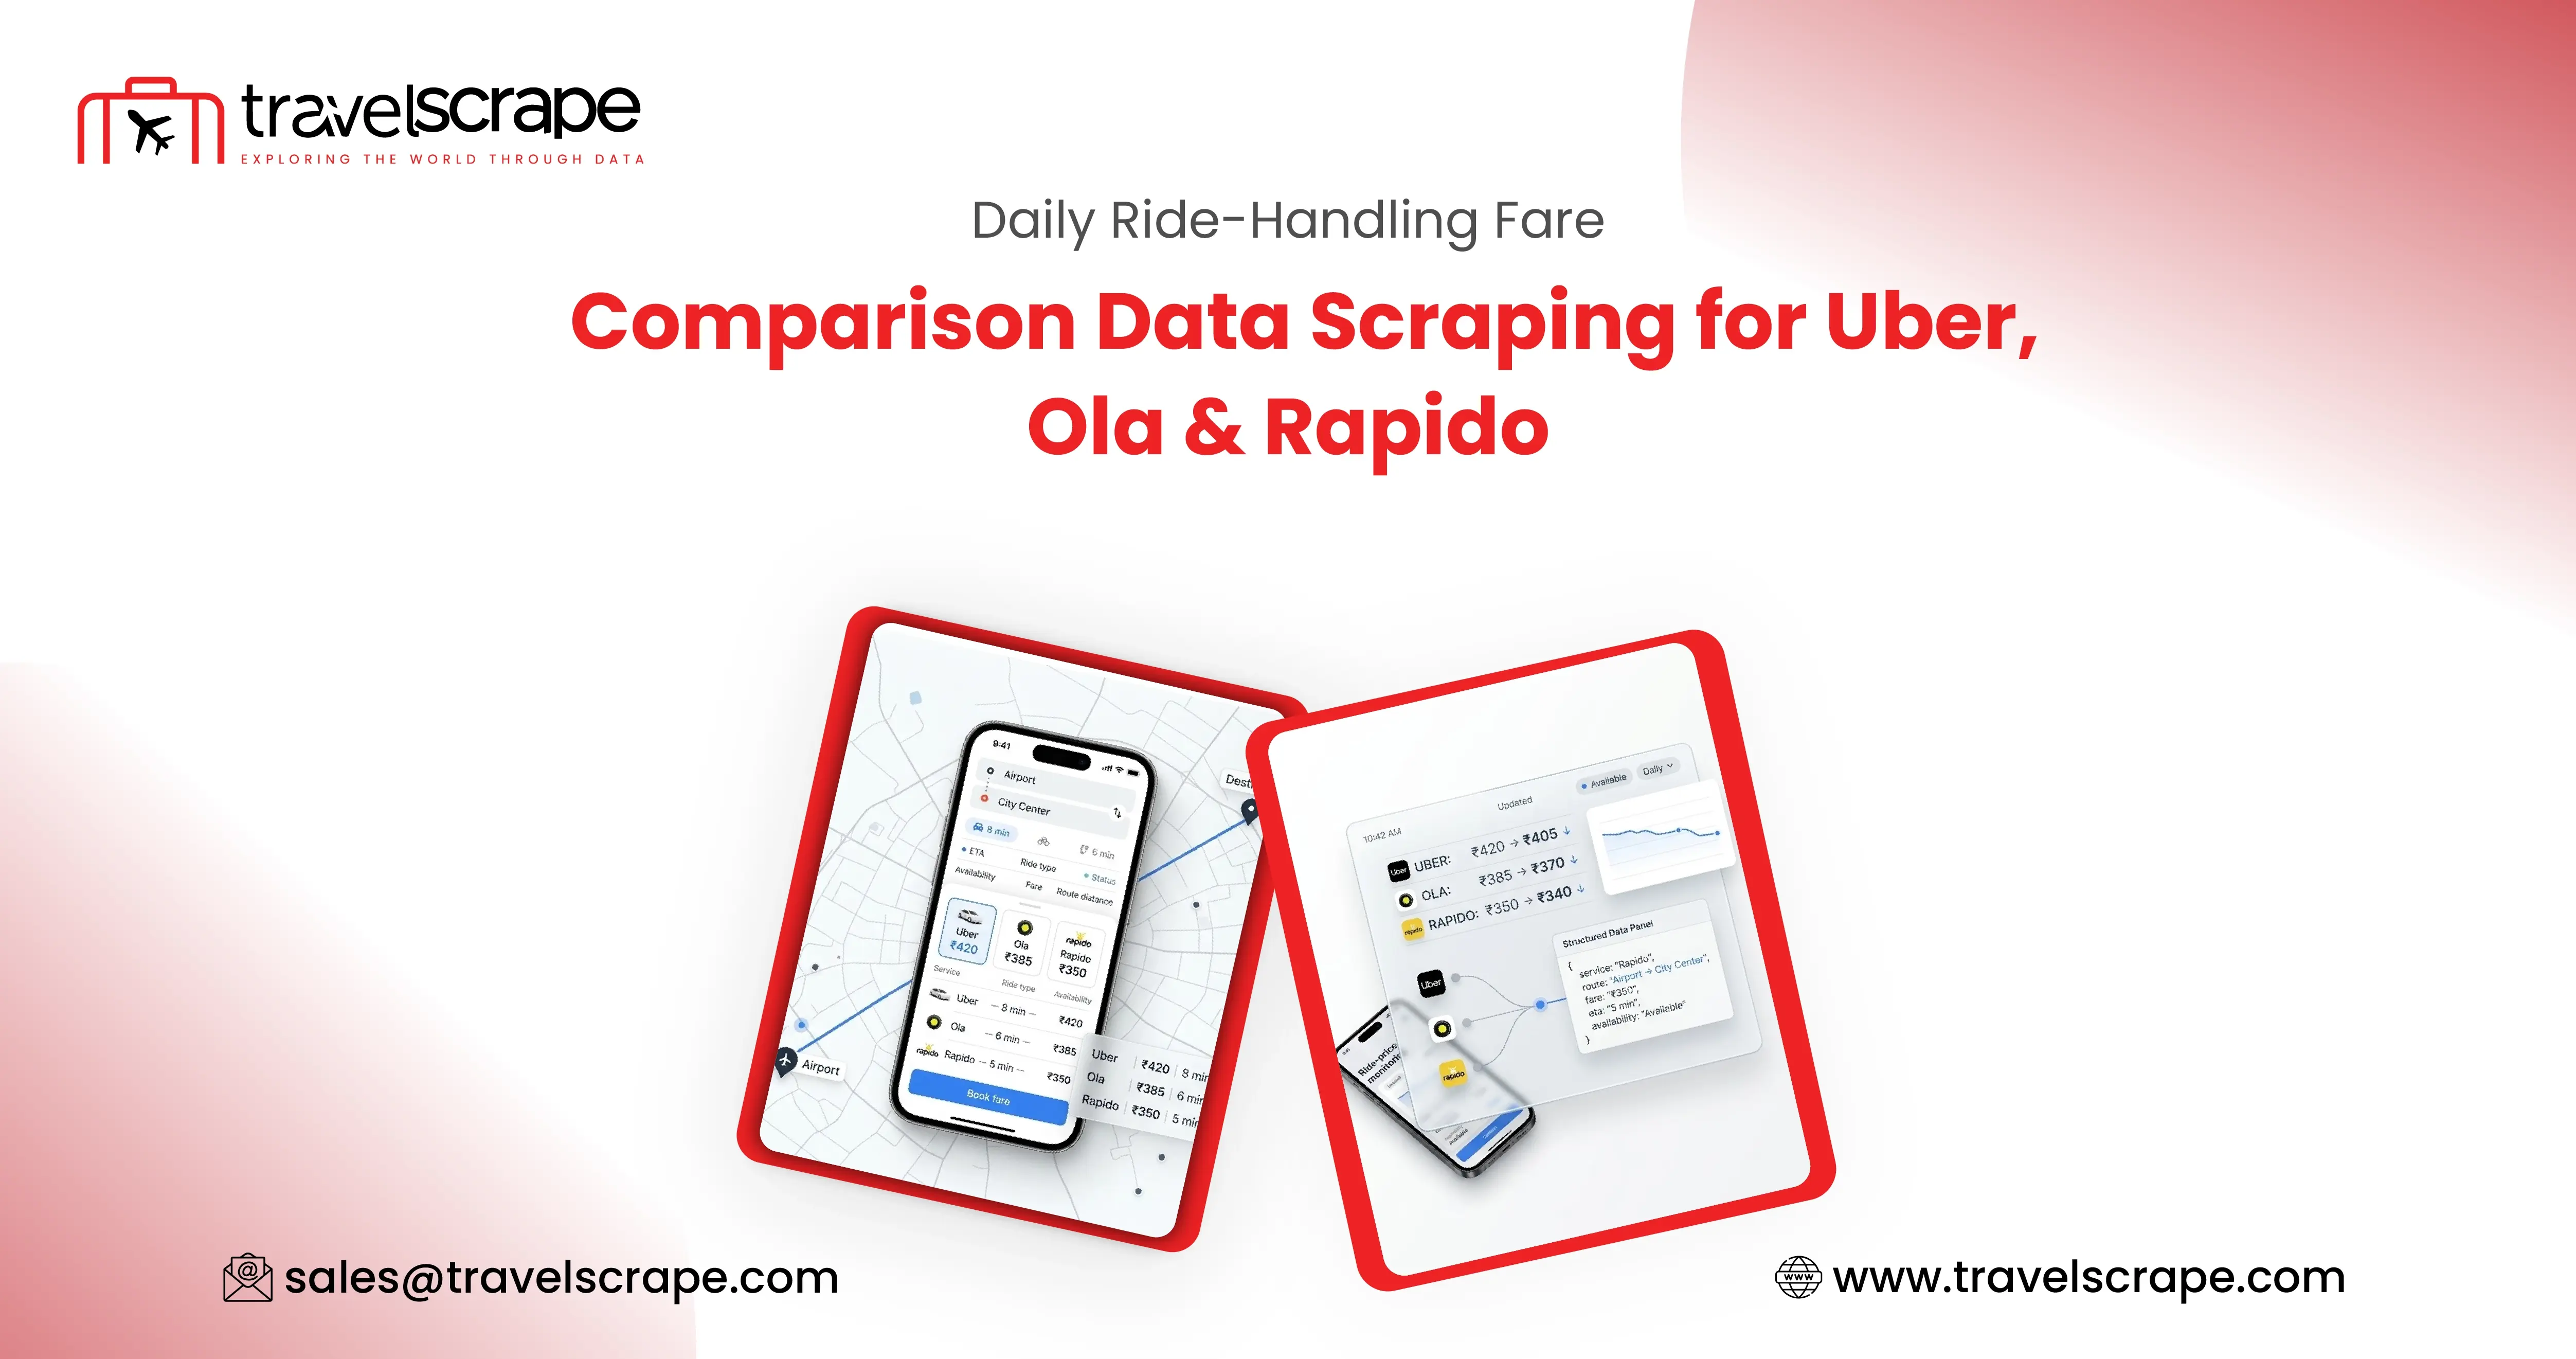
The travel and mobility ecosystem is becoming increasingly dynamic as customers compare ride fares, rental options, availability, and travel deals before making booking decisions. This case study presents a data intelligence solution designed to collect, standardize, and analyze transportation pricing information from leading ride-hailing and car-rental platforms. The project focused on building a reliable Daily Ride-Hailing Fare Comparison Data scraping workflow to capture fluctuating prices across locations, routes, vehicle categories, and booking periods. The collected information supported advanced Ride-Hailing Intelligence by enabling businesses to identify price movements, competitive gaps, and market-level opportunities. A centralized Daily Ride-Hailing Fare Comparison Intelligence dataset was developed to provide structured insights for monitoring transportation costs. The solution combined automated data collection, validation, normalization, and analytics to transform fragmented mobility information into actionable intelligence. Businesses could subsequently use these insights for pricing optimization, competitor benchmarking, demand analysis, travel planning, and strategic decision-making across rapidly changing transportation markets.
The Client
The client was a travel technology and mobility intelligence company developing a centralized platform for monitoring transportation prices across multiple markets. Its objective was to help travel businesses, mobility aggregators, analysts, and corporate travel teams understand changing ride-hailing and rental costs through structured datasets. The company required Ola Rentals Data Scraping to capture rental pricing, vehicle categories, locations, availability, and associated booking information. It also needed Uber Fare Data Scraping to collect comparable fare information across selected routes and vehicle types. In addition, Real-Time Ola Fare Tracking was required to understand frequent price fluctuations and identify periods of significant fare changes. The client wanted a scalable data pipeline capable of handling large volumes of transportation information while maintaining consistency across different platforms. The resulting intelligence would support competitive benchmarking, pricing analysis, route-level comparisons, travel budgeting, and the development of data-driven mobility applications.
Challenges in the Travel Industry
Travel businesses face constantly changing transportation prices, fragmented mobility information, and inconsistent booking conditions. Capturing comparable information at scale requires reliable automation, structured processing, and continuous monitoring across platforms, locations, vehicle types, and time periods.
Dynamic Fare Fluctuations
Ride-hailing prices can change within minutes because of demand, traffic, weather, availability, and surge conditions. This makes static datasets quickly outdated. The client required continuous monitoring to capture meaningful fare movements and distinguish temporary fluctuations from recurring pricing patterns.
Fragmented Rental Information
Uber Rentals Data Scraping presented challenges because rental information could vary according to location, vehicle category, rental duration, availability, and booking conditions. Collecting comparable records required systematic extraction and normalization so that pricing information could be accurately analyzed across different markets.
Cross-Platform Comparison
Creating a Rapido Fare Comparison Dataset required consistent collection from different mobility platforms. Each platform could organize routes, vehicle categories, pricing components, and service information differently. Aligning these variables was essential for generating meaningful comparisons without introducing inconsistencies into the final dataset.
API and Data Accessibility
A Ride-Hailing Fare Comparison API needed standardized information from multiple sources while accounting for differences in data structures, update frequencies, and response formats. Integrating these datasets required robust processing rules capable of converting heterogeneous transportation information into consistent records.
Rental Price Monitoring
Car Rental Data Scraping required capturing pricing, vehicle details, locations, rental durations, availability, and booking conditions. At the same time, Daily Ride-Hailing Fare Monitoring demanded recurring collection schedules to identify price movements and competitive changes across multiple transportation providers.
Our Approach
Automated Data Collection
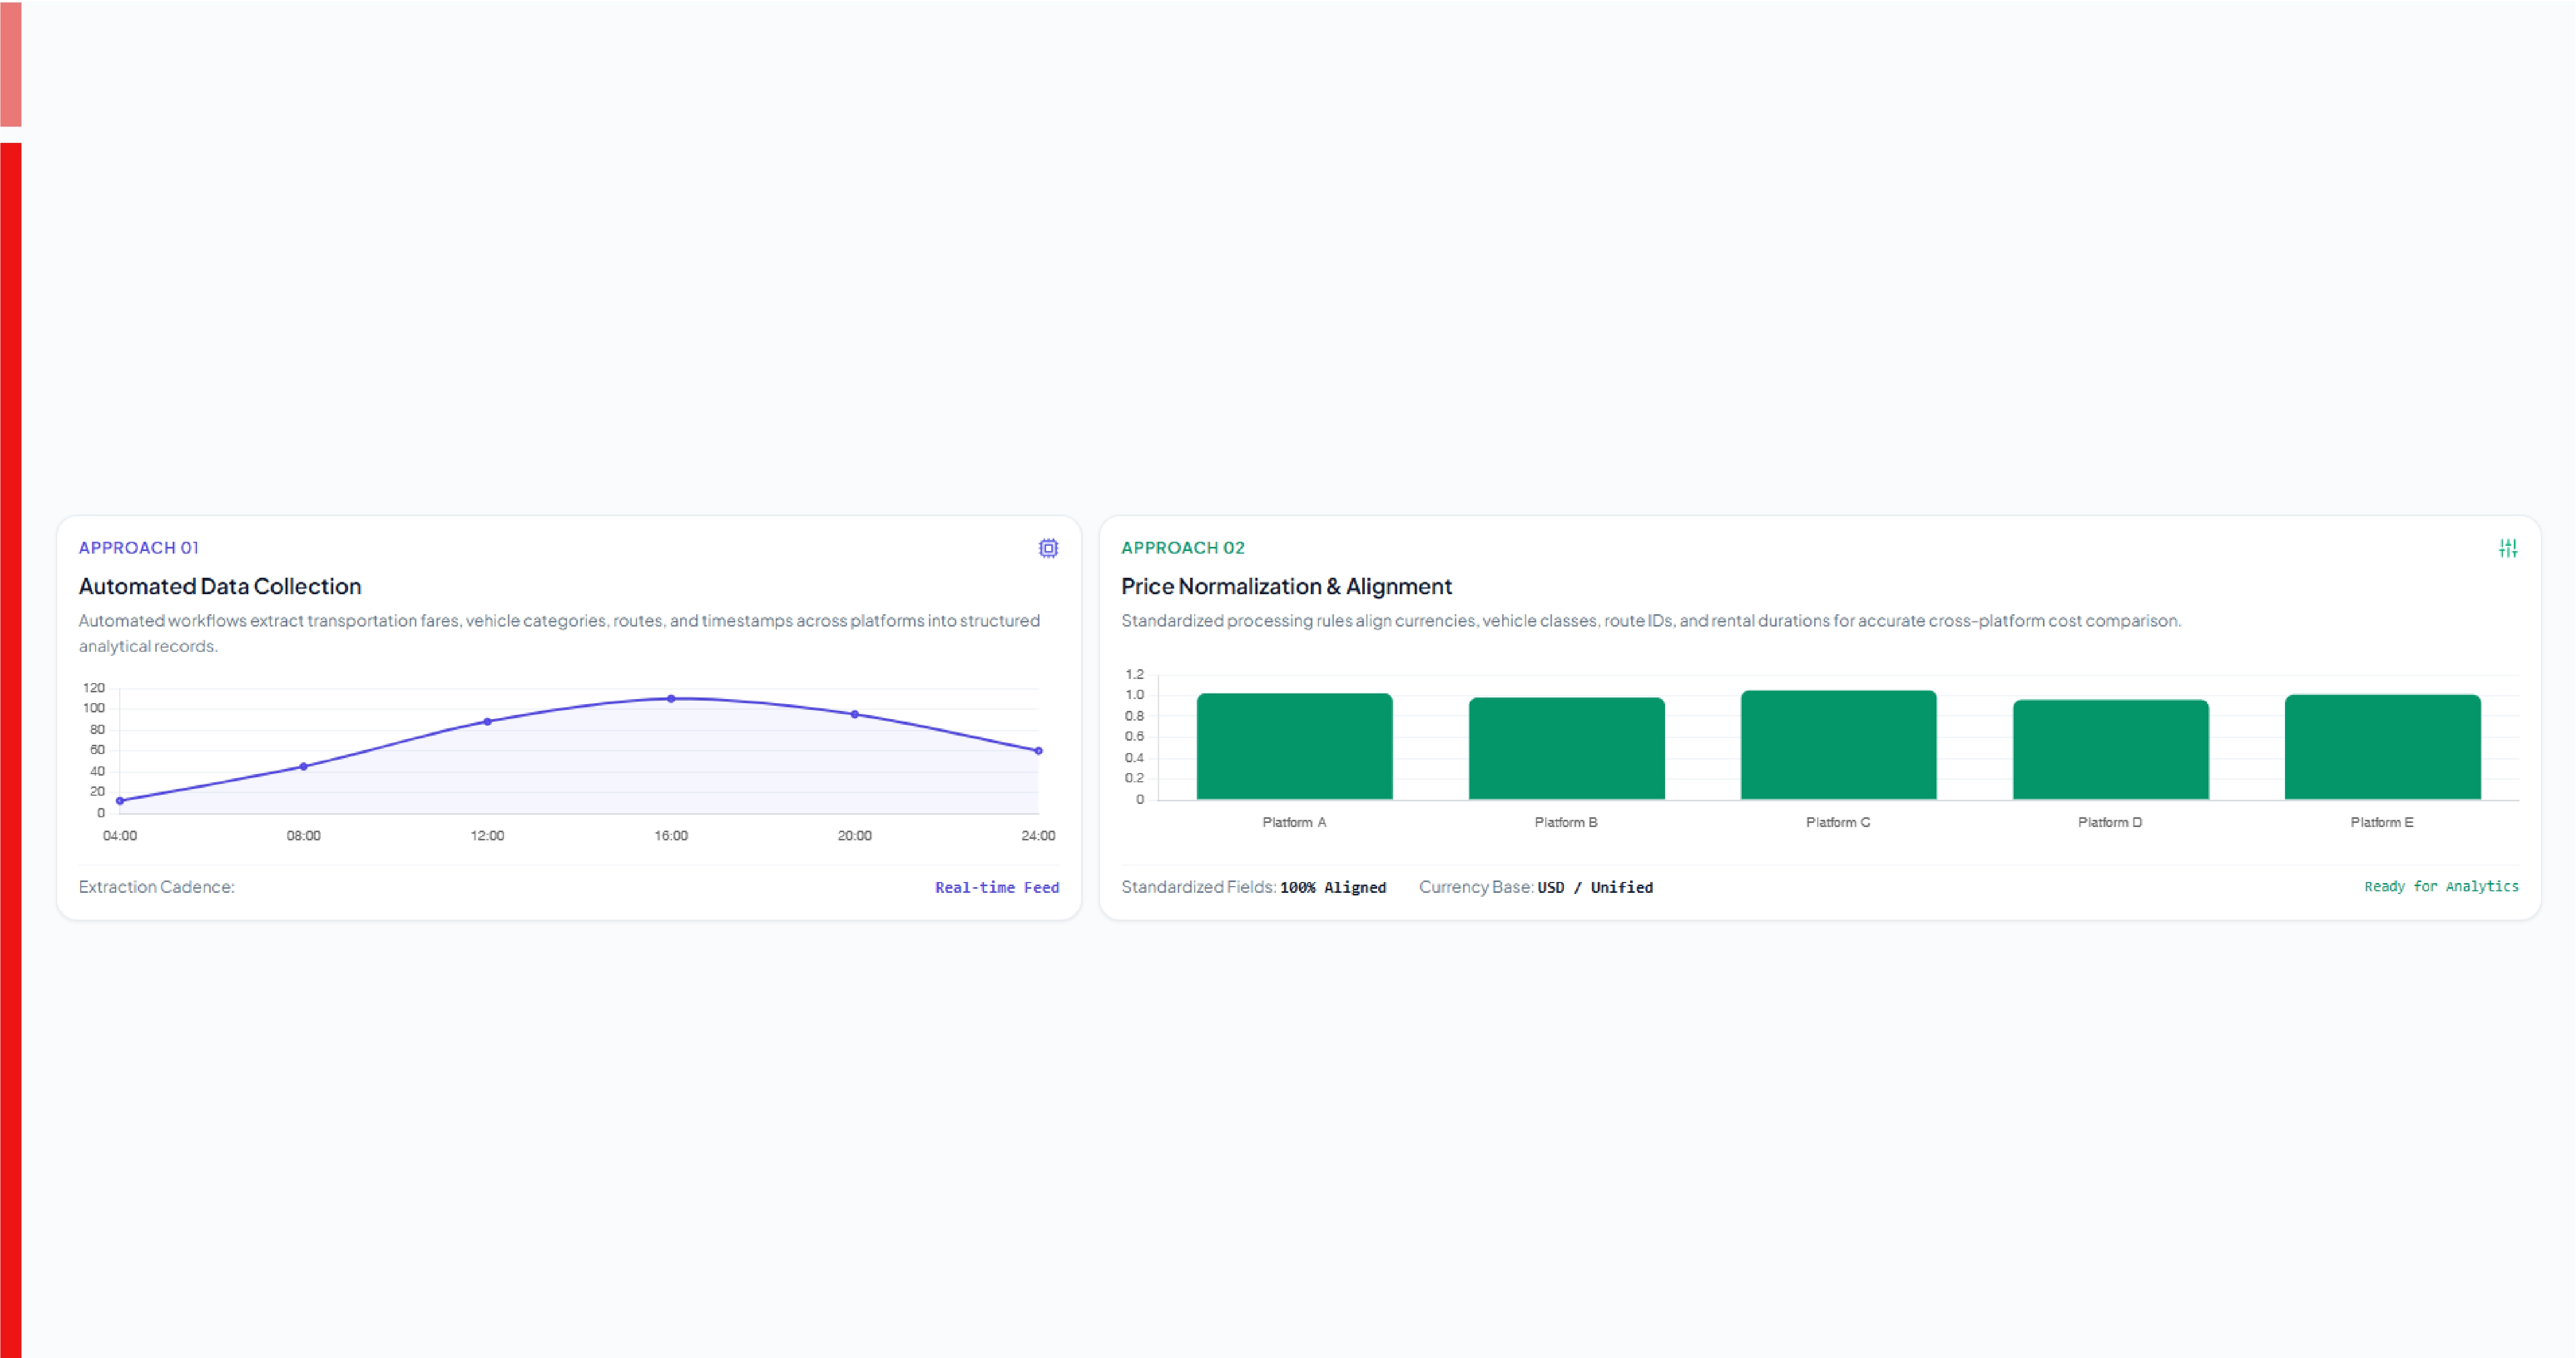
We developed automated extraction workflows to collect transportation pricing and availability information across selected platforms. The process captured route details, vehicle categories, fares, rental prices, locations, timestamps, and relevant booking attributes, creating structured records suitable for downstream comparison and analytics.
Price Normalization
All collected fare information was transformed into consistent formats using standardized fields and processing rules. We aligned currencies, vehicle categories, route identifiers, rental durations, and pricing components, enabling the client to compare transportation costs accurately despite differences between individual platforms.
Historical Dataset Development
The project incorporated recurring data collection to build historical transportation records. A structured Car Rental Price Trends Dataset was created alongside ride-hailing observations, allowing analysts to evaluate pricing patterns, identify seasonal movements, compare markets, and understand how transportation costs evolved over time.
Validation and Quality Checks
Automated validation routines were applied to identify missing values, duplicate records, abnormal fares, incomplete locations, and inconsistent vehicle classifications. Records were cleaned and standardized before delivery, improving dataset reliability and ensuring that analytical outputs were based on usable and comparable transportation information.
Structured Data Delivery
The processed information was organized into machine-readable datasets with clearly defined fields and timestamps. Data could be supplied in formats suitable for dashboards, analytics platforms, databases, APIs, and business intelligence systems, allowing the client to integrate transportation intelligence into its existing technology environment.
Results Achieved
The solution transformed fragmented transportation information into structured intelligence, enabling faster comparisons, stronger market analysis, and more informed mobility pricing decisions.
Expanded Fare Visibility
The client gained centralized visibility into transportation fares across multiple platforms, routes, locations, and vehicle categories. This made it easier to identify pricing differences, track changes, and evaluate competitive positioning using consistently structured transportation records.
Faster Competitive Benchmarking
Automated collection reduced the dependency on manual price checking and enabled regular comparisons between competing mobility providers. Analysts could evaluate fare differences more efficiently and identify locations or routes where significant pricing gaps appeared.
Improved Historical Analysis
Recurring extraction generated historical records that could be used to examine transportation pricing patterns over time. Businesses could investigate peak-period pricing, recurring fluctuations, rental trends, and market-level changes to support forecasting and strategic planning.
Better Pricing Intelligence
Standardized datasets helped the client identify fare movements across transportation categories. Comparing ride-hailing and rental prices enabled analysts to understand customer alternatives and evaluate how pricing changes could influence transportation choices across different routes and markets.
Scalable Data Infrastructure
The automated workflow provided a scalable foundation for ongoing transportation intelligence. New locations, providers, vehicle categories, and data fields could be incorporated into the collection framework, supporting future expansion without requiring a complete redesign of the data pipeline.
Scraped Data Sample
| Record ID | Platform | City | Route ID | Vehicle Type | Base Fare | Surge Multiplier | Total Fare | Rental Price | Currency | Distance KM | Duration Min | Availability | Rating | Timestamp |
|---|---|---|---|---|---|---|---|---|---|---|---|---|---|---|
| 1001 | Ola | Delhi | 501 | Sedan | 145 | 1.2 | 174 | 1,850 | INR | 12.4 | 34 | 18 | 4.5 | 08:15 |
| 1002 | Uber | Delhi | 501 | Sedan | 152 | 1.3 | 198 | 1,920 | INR | 12.4 | 35 | 16 | 4.6 | 08:15 |
| 1003 | Rapido | Delhi | 501 | Bike | 68 | 1.1 | 75 | 950 | INR | 12.1 | 29 | 31 | 4.4 | 08:15 |
| 1004 | Ola | Mumbai | 502 | Prime | 210 | 1.4 | 294 | 2,350 | INR | 15.7 | 42 | 14 | 4.5 | 09:00 |
| 1005 | Uber | Mumbai | 502 | Comfort | 225 | 1.5 | 338 | 2,480 | INR | 15.7 | 43 | 12 | 4.6 | 09:00 |
| 1006 | Rapido | Mumbai | 502 | Auto | 115 | 1.2 | 138 | 1,150 | INR | 14.9 | 39 | 24 | 4.3 | 09:00 |
| 1007 | Ola | Bengaluru | 503 | Mini | 98 | 1.1 | 108 | 1,420 | INR | 9.8 | 31 | 22 | 4.4 | 10:20 |
| 1008 | Uber | Bengaluru | 503 | Go | 105 | 1.2 | 126 | 1,490 | INR | 9.8 | 32 | 20 | 4.5 | 10:20 |
| 1009 | Rapido | Bengaluru | 503 | Bike | 55 | 1.1 | 61 | 880 | INR | 9.4 | 25 | 35 | 4.5 | 10:20 |
| 1010 | Ola | Hyderabad | 504 | Sedan | 132 | 1.3 | 172 | 1,690 | INR | 11.6 | 33 | 19 | 4.4 | 11:45 |
| 1011 | Uber | Hyderabad | 504 | Sedan | 140 | 1.4 | 196 | 1,760 | INR | 11.6 | 34 | 17 | 4.5 | 11:45 |
| 1012 | Rapido | Hyderabad | 504 | Auto | 88 | 1.1 | 97 | 1,020 | INR | 10.9 | 30 | 28 | 4.3 | 11:45 |
Client's Testimonial
"The data intelligence solution significantly improved our ability to understand transportation pricing across different mobility providers. Previously, collecting comparable fare information required substantial manual effort and delivered inconsistent results. The automated workflow gave our team structured, frequently refreshed datasets covering fares, rental prices, availability, vehicle categories, and routes. This helped us benchmark competitors, identify pricing movements, and build stronger analytical models. We particularly valued the standardized format because our analysts could immediately integrate the information into dashboards and internal systems. The scalable architecture also gives us confidence that we can expand coverage to additional cities, providers, and transportation categories as our business grows."
Conclusion
Transportation pricing changes rapidly, making dependable data collection essential for modern travel and mobility businesses. This case study demonstrates how automated extraction and structured processing can transform scattered fare and rental information into actionable market intelligence. By continuously collecting, validating, normalizing, and organizing transportation data, businesses can improve competitor benchmarking, pricing analysis, historical research, and travel planning. The solution also creates a foundation for advanced analytics, forecasting, and mobility applications that require reliable transportation datasets. Organizations looking to Scrape Aggregated Travel Deals can similarly combine multiple travel data sources to develop broader market visibility. Professional Travel Industry Web Scraping Services can further support scalable data acquisition, while a specialized Travel Mobile App Scraping Service can help businesses collect mobile-oriented transportation and travel information. Together, these capabilities enable travel companies to respond more effectively to changing prices, consumer behavior, and competitive market conditions.
FAQs
Unlock the Full Report
Enter your details to access premium pricing intelligence insights