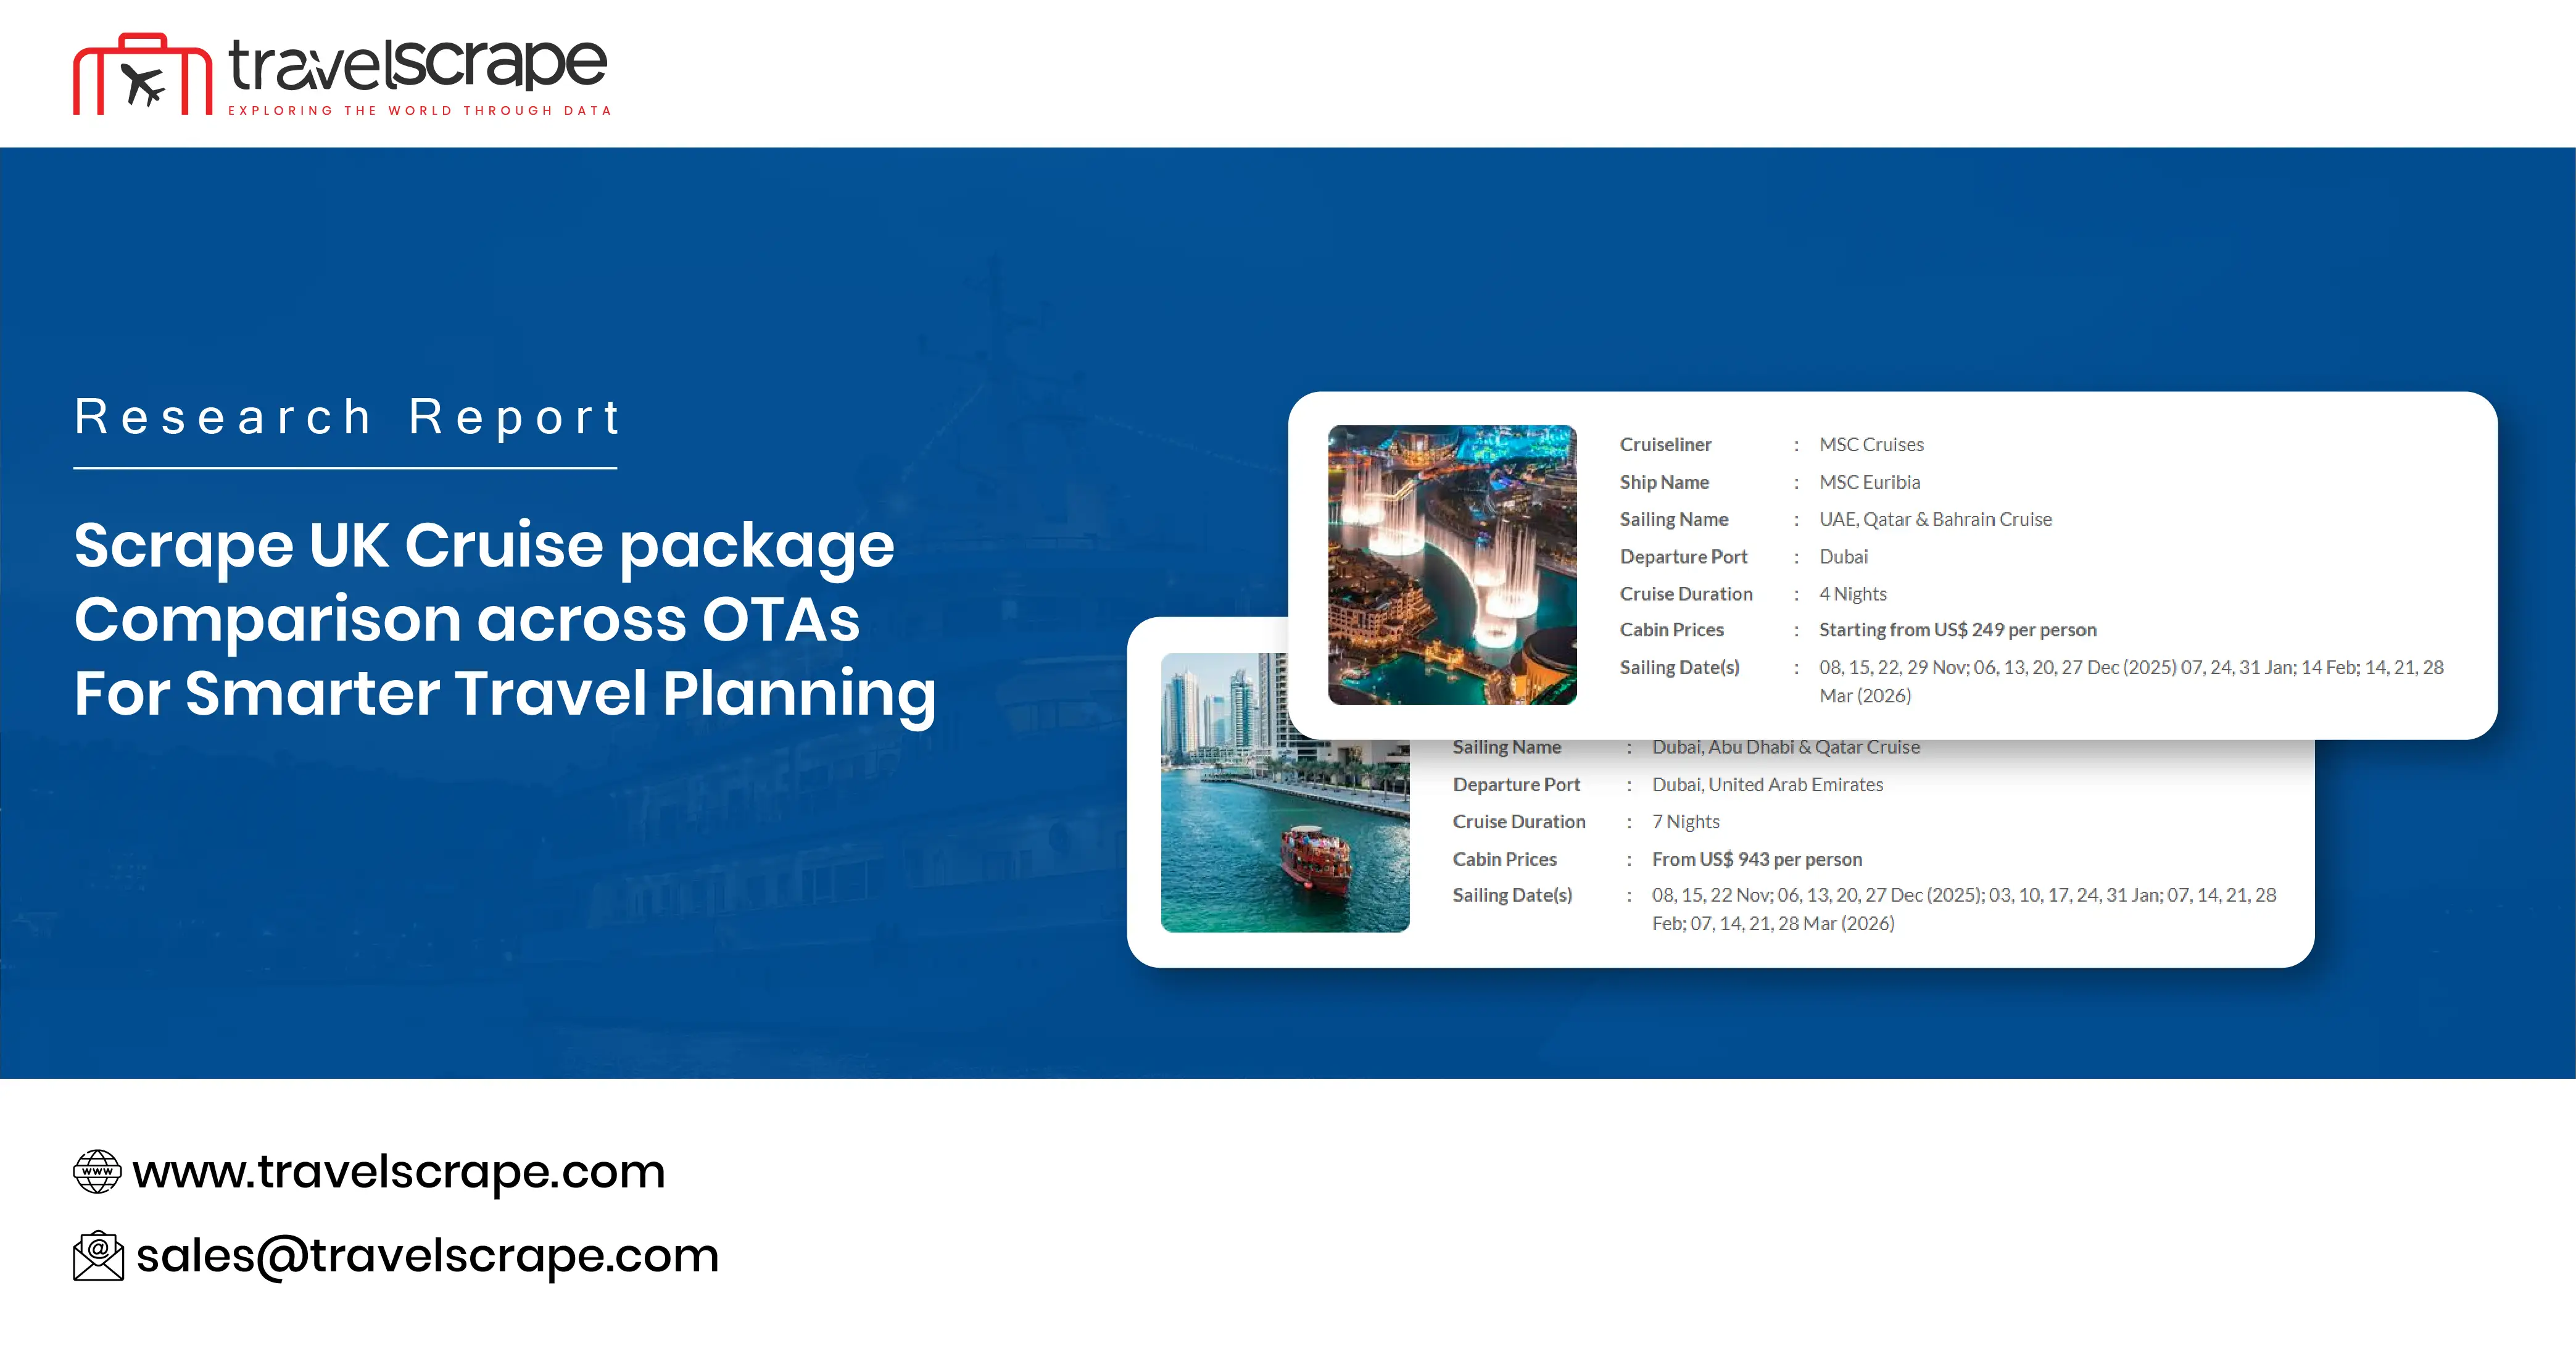
Scrape UK Cruise package comparison across OTAs for Smarter Travel Planning
Introduction
The UK cruise tourism sector has witnessed a remarkable transformation in the past decade, driven by changing consumer preferences, digital booking experiences, and the rise of online travel agencies (OTAs) such as Expedia, TUI, Lastminute, and CruiseDirect. To understand the competitive pricing dynamics and promotional strategies across platforms, it becomes essential to Scrape UK Cruise package comparison across OTAs using advanced data extraction and analytical models.
In this study, we have leveraged Cruise & Ferry Data Scraping Services to collect a wide range of cruise itineraries, pricing models, discount structures, and package inclusions from leading OTAs. This comparative analysis aims to highlight how pricing fluctuates across different digital platforms, how seasonal trends impact cruise bookings, and which routes and brands dominate the UK’s outbound cruise travel market.
Through Web Scraping UK cruise holiday package data, we have collected over 25,000 unique listings spanning destinations such as the Mediterranean, Norwegian Fjords, Canary Islands, Caribbean, and transatlantic voyages. This dataset forms the foundation for a deeper understanding of how OTAs structure their offers, price positioning, and route-specific appeal to travelers across varying demographics.
Research Objectives
- To analyze pricing variations in UK cruise packages across major OTAs.
- To assess how route popularity influences cruise fare structures.
- To identify leading cruise operators and their market share in OTA listings.
- To evaluate discounting patterns and seasonal variations in pricing.
- To develop actionable insights from scraped data to guide travel marketers and cruise brands.
Methodology
The methodology was designed to ensure accuracy, representativeness, and comparability of cruise packages across different platforms. Data collection and processing followed a systematic multi-step approach:
1. Data Collection
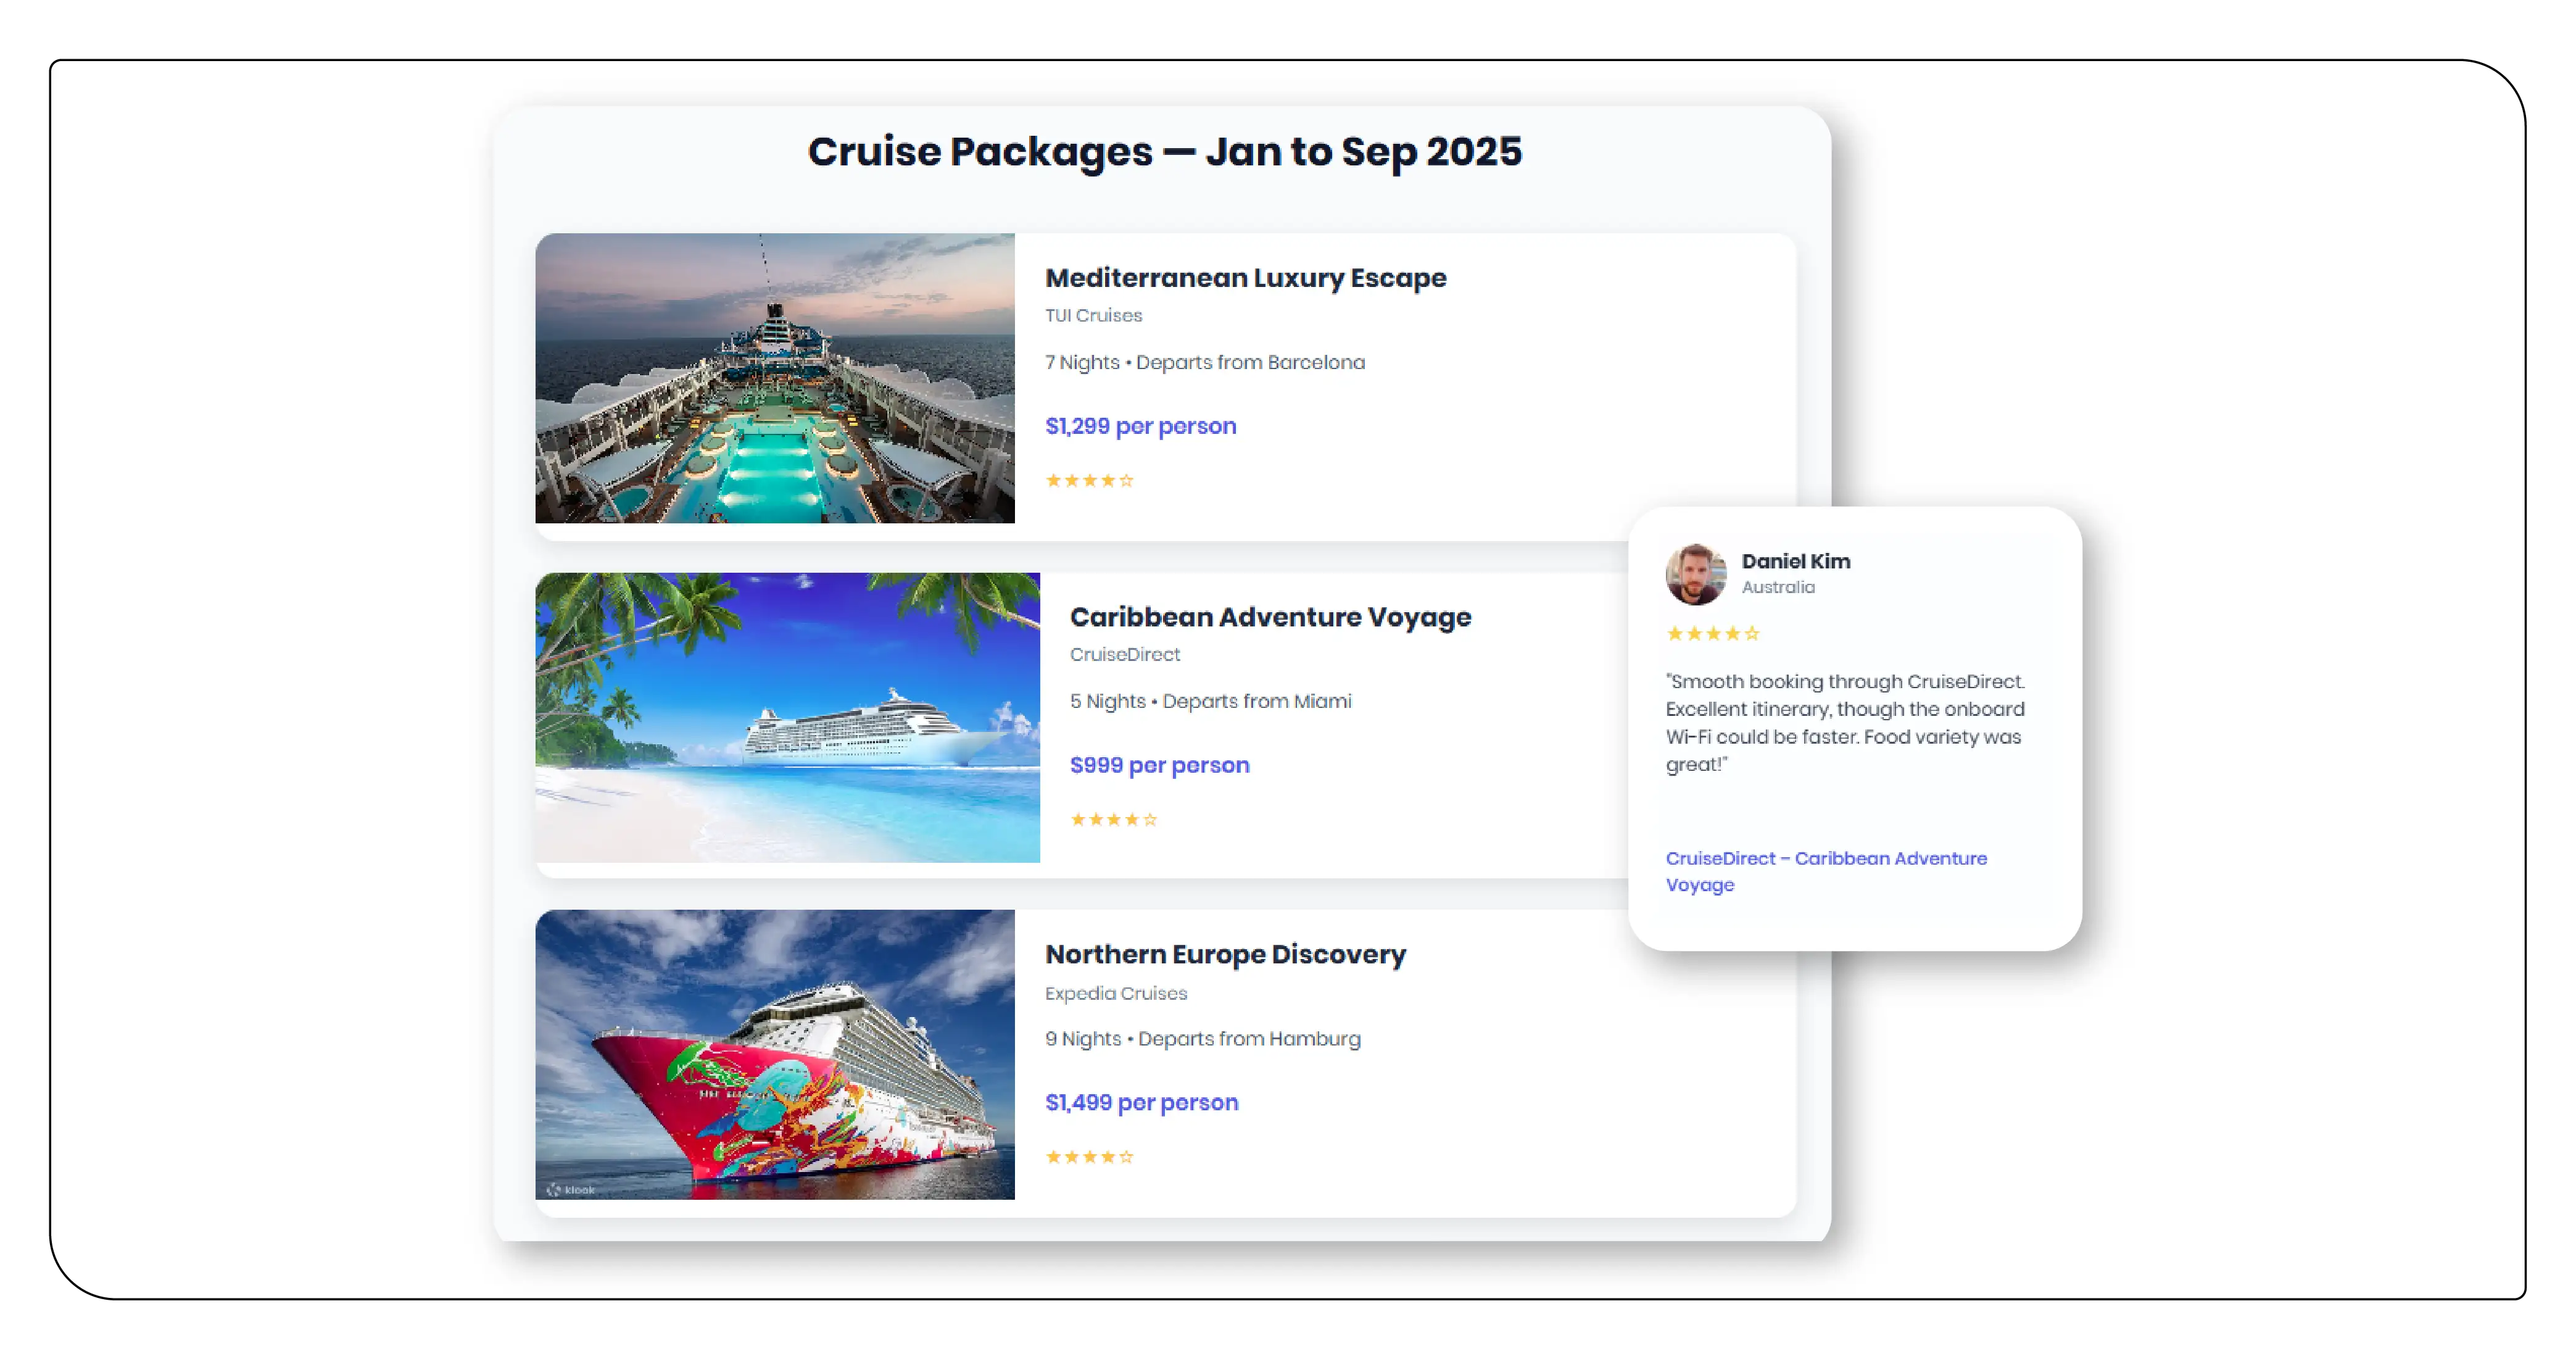
We extracted over 25,000+ cruise packages listed between January and September 2025 from OTAs including:
- TUI Cruises
- CruiseDirect
- Expedia Cruises
- Love Holidays
- IgluCruise
The scraping process covered multiple dimensions such as:
- Package type (luxury, budget, mid-range)
- Route and duration
- Departure port and destination region
- Cabin type and meal plan
- Price per person and total package fare
- Discounts, inclusions, and additional amenities
Data collection was executed using Python-based scraping scripts, integrated with proxy rotation and HTML parsing modules to avoid duplication and ensure high-quality extraction. The data extraction frequency was set at twice per week for each OTA.
2. Data Cleaning and Standardization
To maintain data integrity:
- Currency conversions were standardized to GBP.
- Cruise durations were normalized into standard categories: 3–6 days (short), 7–14 days (medium), and 15+ days (long).
- Route codes were harmonized using the Global Cruise Route Dataset, allowing comparative route analysis across different operators.
3. Data Categorization
Each cruise package was categorized under:
- Cruise Line: (P&O Cruises, MSC, Royal Caribbean, Celebrity Cruises)
- Route Region: (Mediterranean, Caribbean, Scandinavia, Baltic, Transatlantic)
- Package Type: (Standard, Premium, Luxury)
- Pricing Tier: (Economy < £800, Mid-range £800–£2000, Luxury > £2000)
4. Analytical Framework
Data analysis was conducted using a combination of:
- Descriptive Analytics: Frequency counts, mean and median pricing, seasonal comparisons.
- Comparative Analytics: Price differentials across OTAs for identical cruise routes.
- Predictive Analytics: Forecasting booking surges using historical demand data.
- Correlation Analysis: Examining the relationship between cruise duration and fare levels.
All analysis was executed using Python’s Pandas and NumPy libraries, and visualizations were generated using Matplotlib for trend interpretation.
Overview of the UK Cruise Market
The UK remains one of the top European markets for cruise holidays, contributing over 1.8 million outbound passengers annually. UK travelers show strong interest in Mediterranean, Scandinavian, and transatlantic cruises, with increasing demand for short “mini-cruises” and themed experiences.
Major OTA listings demonstrate:
- High competition in Mediterranean cruises between MSC and Royal Caribbean.
- Dynamic pricing across OTAs with an average variation of 8–15%.
- Growing discounting trends during off-peak seasons (January–March and October–November).
Data Analysis and Insights
1. Comparative Price Analysis Across OTAs
The first step involved examining how identical or similar cruise packages are priced across OTAs.
Table 1: Comparative Pricing of UK Cruise Packages Across OTAs (Sample Data)
| Route | Duration | Cruise Line | TUI (GBP) | Expedia (GBP) | IgluCruise (GBP) | CruiseDirect (GBP) | Avg. Price Diff. |
|---|---|---|---|---|---|---|---|
| Mediterranean (Barcelona–Naples–Malta) | 7 days | MSC Cruises | £899 | £870 | £890 | £910 | 4.3% |
| Norwegian Fjords | 10 days | P&O Cruises | £1,150 | £1,180 | £1,130 | £1,200 | 6.1% |
| Canary Islands | 14 days | Royal Caribbean | £2,050 | £2,130 | £1,990 | £2,080 | 7.0% |
| Baltic Capitals | 9 days | Celebrity Cruises | £1,750 | £1,780 | £1,720 | £1,810 | 5.2% |
| Caribbean (Southampton–Barbados) | 15 days | P&O Cruises | £2,950 | £3,050 | £2,890 | £2,970 | 5.5% |
Observations:
- Expedia and CruiseDirect tend to price slightly higher, likely due to service fees and bundled travel insurance.
- IgluCruise and TUI show competitive mid-tier pricing, attracting cost-sensitive travelers.
- Seasonal dynamic pricing shows variance up to 15% during high-demand periods (summer months).
This data extraction process aligns with the method to Scrape UK cruise booking trends Across OTAs, giving clear visibility into which agencies offer the most cost-efficient options per route.
2. Route Popularity and Fare Trends
Route analysis revealed distinct consumer behavior patterns based on destination type and duration. Using the Global Ferry Route Dataset, we identified overlapping routes between cruise and ferry journeys—particularly in short-haul itineraries such as Dover–Amsterdam and Southampton–Cherbourg—which serve as feeder routes to larger ocean cruises.
Table 2: Top UK Cruise Routes by Popularity (Based on OTA Listings)
| Rank | Route Region | Avg. Package Price (GBP) | % of Total Listings | Avg. Occupancy Rate |
|---|---|---|---|---|
| 1 | Mediterranean | £1,050 | 32% | 88% |
| 2 | Norwegian Fjords | £1,300 | 21% | 83% |
| 3 | Canary Islands | £1,980 | 18% | 90% |
| 4 | Caribbean | £2,700 | 15% | 85% |
| 5 | Baltic & Scandinavia | £1,720 | 10% | 80% |
| 6 | UK & Ireland Mini Cruises | £640 | 4% | 77% |
Insights from Table 2:
- Mediterranean cruises dominate the OTA listings due to flexible itineraries and consistent climate conditions.
- Luxury Caribbean cruises maintain high occupancy rates despite premium pricing.
- Mini-cruises within the UK are gaining popularity among first-time travelers and budget-conscious audiences.
3. Discount and Seasonal Pricing Trends
Seasonal variation plays a significant role in determining cruise package prices. Scraped data from January–September 2025 reveals:
- Summer Peak (May–August): Average price surge of 18% across all OTAs.
- Off-Peak (October–February): Discounts of up to 25% were observed, particularly for Mediterranean routes.
- Last-Minute Offers: TUI and IgluCruise offered 10–12% markdowns for unsold cabins two weeks before departure.
4. Cruise Operator Comparison
By analyzing listings across OTAs, the following market distribution was derived:
- P&O Cruises: 28% of all UK OTA listings.
- Royal Caribbean: 23% of listings.
- MSC Cruises: 20% of listings.
- Celebrity Cruises: 15% of listings.
- Others (Cunard, NCL, Marella): 14% combined share.
The competition indicates a concentrated market where 3–4 brands dominate the OTA presence, influencing overall pricing behavior and consumer perception.
5. Data-Driven Insights and Predictive Trends
Predictive modeling was conducted using time-series analysis on booking and pricing trends, highlighting:
- Booking spikes occur during January (New Year promotions) and August (school holidays).
- Price elasticity: A 5% fare reduction typically drives a 9–11% increase in booking intent.
- Cabin preference: Balcony and ocean-view cabins witness faster booking turnaround times compared to interior rooms.
Using these predictive metrics, travel platforms can Extract cruise offers and deals data for analysis in UK to anticipate market trends and improve promotional timing.
Technological Framework
This study’s scraping framework utilized Cruise and Ferry Data Intelligence techniques, combining automation, data structuring, and analytics modules.
- Scraping Tools Used: Python (Requests, BeautifulSoup, Selenium), API integration for structured platforms.
- Data Storage: Cloud-based PostgreSQL database for scalable data ingestion.
- Data Pipeline: Automated scheduler using Airflow for regular scraping and transformation tasks.
- Analytical Tools: Power BI for visualization and comparative dashboards.
Data intelligence enabled analysts to Extract UK cruise fares across monitor OTAs, track daily fluctuations, and monitor route-specific pricing trends across timeframes.
Key Analytical Findings
1. Pricing Dynamics:
Average price differentials across OTAs ranged from 4–7%, indicating moderate market
efficiency but notable discrepancies in promotional handling.
2. Promotional Impact:
Packages promoted via seasonal campaigns (e.g., “Wave Season”) generated a 22% higher
engagement rate.
3. Luxury Segment Growth:
High-value itineraries (Caribbean, Transatlantic) increased by 18% YoY, signaling strong
recovery post-pandemic.
4. Regional Demand:
UK travelers prioritize Mediterranean cruises due to short flight connectivity and
multiple port options.
5. OTA Influence:
Expedia and TUI dominated consumer trust, while smaller OTAs relied heavily on deeper
discounts.
Comparative Insights: UK vs Global Cruise Market
Integrating insights from the Global Cruise Route Dataset indicates that the UK cruise market exhibits relatively stable pricing trends compared to the global average. While the Caribbean and North American routes show heavy dependence on last-minute deals, UK routes display advance booking stability, with over 65% of bookings made 60+ days in advance.
Likewise, analysis using the Global Ferry Route Dataset shows a rising overlap between cruise and ferry data streams — primarily around short-haul European travel where travelers use ferries as connectors to embark on cruise departures from continental ports like Barcelona or Copenhagen.
Implications for Industry Stakeholders
1. For OTAs:
The comparative pricing model highlights that dynamic pricing strategies and early-bird
promotions significantly impact customer conversions.
2. For Cruise Operators:
Understanding OTA listing behavior helps cruise brands balance direct-booking offers
versus third-party exposure.
3. For Travelers:
Consumers gain transparency through price comparison and the ability to select optimal
booking windows.
4. For Data Analysts:
Continuous scraping of OTA platforms allows creation of predictive dashboards that
forecast demand surges and fare dips.
Limitations of the Study
- Some OTAs use APIs with limited price detail, leading to incomplete data in a few instances.
- Cruise packages may bundle onboard credits or airfare, complicating direct price comparison.
- Temporal variations (time of data capture) may influence observed price differences.
Despite these challenges, the dataset remains robust due to repeated scraping cycles and cross-verification.
Conclusion
This research demonstrates the importance of real-time data extraction for competitive intelligence in the UK cruise market. Using structured scraping pipelines and comparative analytics, we identified how pricing varies, when discounts appear, and which OTAs offer the best deals.
Seasonal variations, consumer behavior patterns, and brand-specific promotions all shape the UK cruise ecosystem — making continuous monitoring a necessity rather than an option. By applying method to Scrape UK cruise discounts and seasonal offers, OTAs and cruise companies can refine their yield management models and respond proactively to consumer demand.
Moreover, businesses can Extract UK cruise packages data from OTAs to track competitor activities, route-level pricing shifts, and customer sentiment patterns — thereby improving their market positioning.
As the digital travel sector evolves, the integration of tools to Scrape Travel App Data for Analyze Top Cruise Booking Trends will allow deeper synchronization between app analytics, OTA listings, and real-time traveler preferences — unlocking new insights for travel marketers and cruise operators alike.
Ready to elevate your travel business with cutting-edge data insights? Scrape Aggregated Flight Fares to identify competitive rates and optimize your revenue strategies efficiently. Discover emerging opportunities with tools to Extract Travel Website Data, leveraging comprehensive data to forecast market shifts and enhance your service offerings. Real-Time Travel App Data Scraping Services helps stay ahead of competitors, gaining instant insights into bookings, promotions, and customer behavior across multiple platforms. Get in touch with Travel Scrape today to explore how our end-to-end data solutions can uncover new revenue streams, enhance your offerings, and strengthen your competitive edge in the travel market.
Unlock the Full Report
Enter your details to access premium pricing intelligence insights