U.S. Tourism Review Trends Data Scrape Across Yelp, TripAdvisor and Google

Introduction
The U.S. travel and hospitality industry increasingly relies on structured digital feedback to understand traveler satisfaction, service gaps, and destination demand patterns. This research report presents a comprehensive analysis of U.S. Tourism Review Trends Data Scrape across three U.S. destinations—Cincinnati (Ohio), Sevierville/Pigeon Forge (Tennessee), and Pinehurst (North Carolina).
By leveraging structured Travel & Tourism Datasets, tourism boards, hotel chains, restaurant groups, and destination marketers can quantify visitor sentiment and review volume trends across multiple platforms.
This study incorporates Yelp tourism review data scraping to gather restaurant, attraction, and hospitality reviews, alongside structured feedback from TripAdvisor and Google Reviews to build a multi-platform sentiment model.
A unified Customer Feedback Sentiment Dataset was developed to analyze review volume, rating distribution, seasonal patterns, and traveler commentary themes across selected cities.
Research Objectives
- Measure review volume and engagement levels across platforms.
- Compare average ratings and sentiment distribution by city.
- Identify dominant experience themes and recurring service gaps.
- Evaluate seasonal spikes in review activity.
- Deliver cross-city benchmarking insights for tourism stakeholders.
Methodology
The research integrates structured review extraction using:
- TripAdvisor tourism review data extraction
- Google Reviews dataset modeling
- Yelp structured hospitality review feeds
Data points collected include:
- Review date
- Rating (1–5 scale)
- Reviewer location (when available)
- Category (Hotel, Attraction, Dining, Entertainment)
- Text content for sentiment scoring
- Engagement signals (likes, helpful votes)
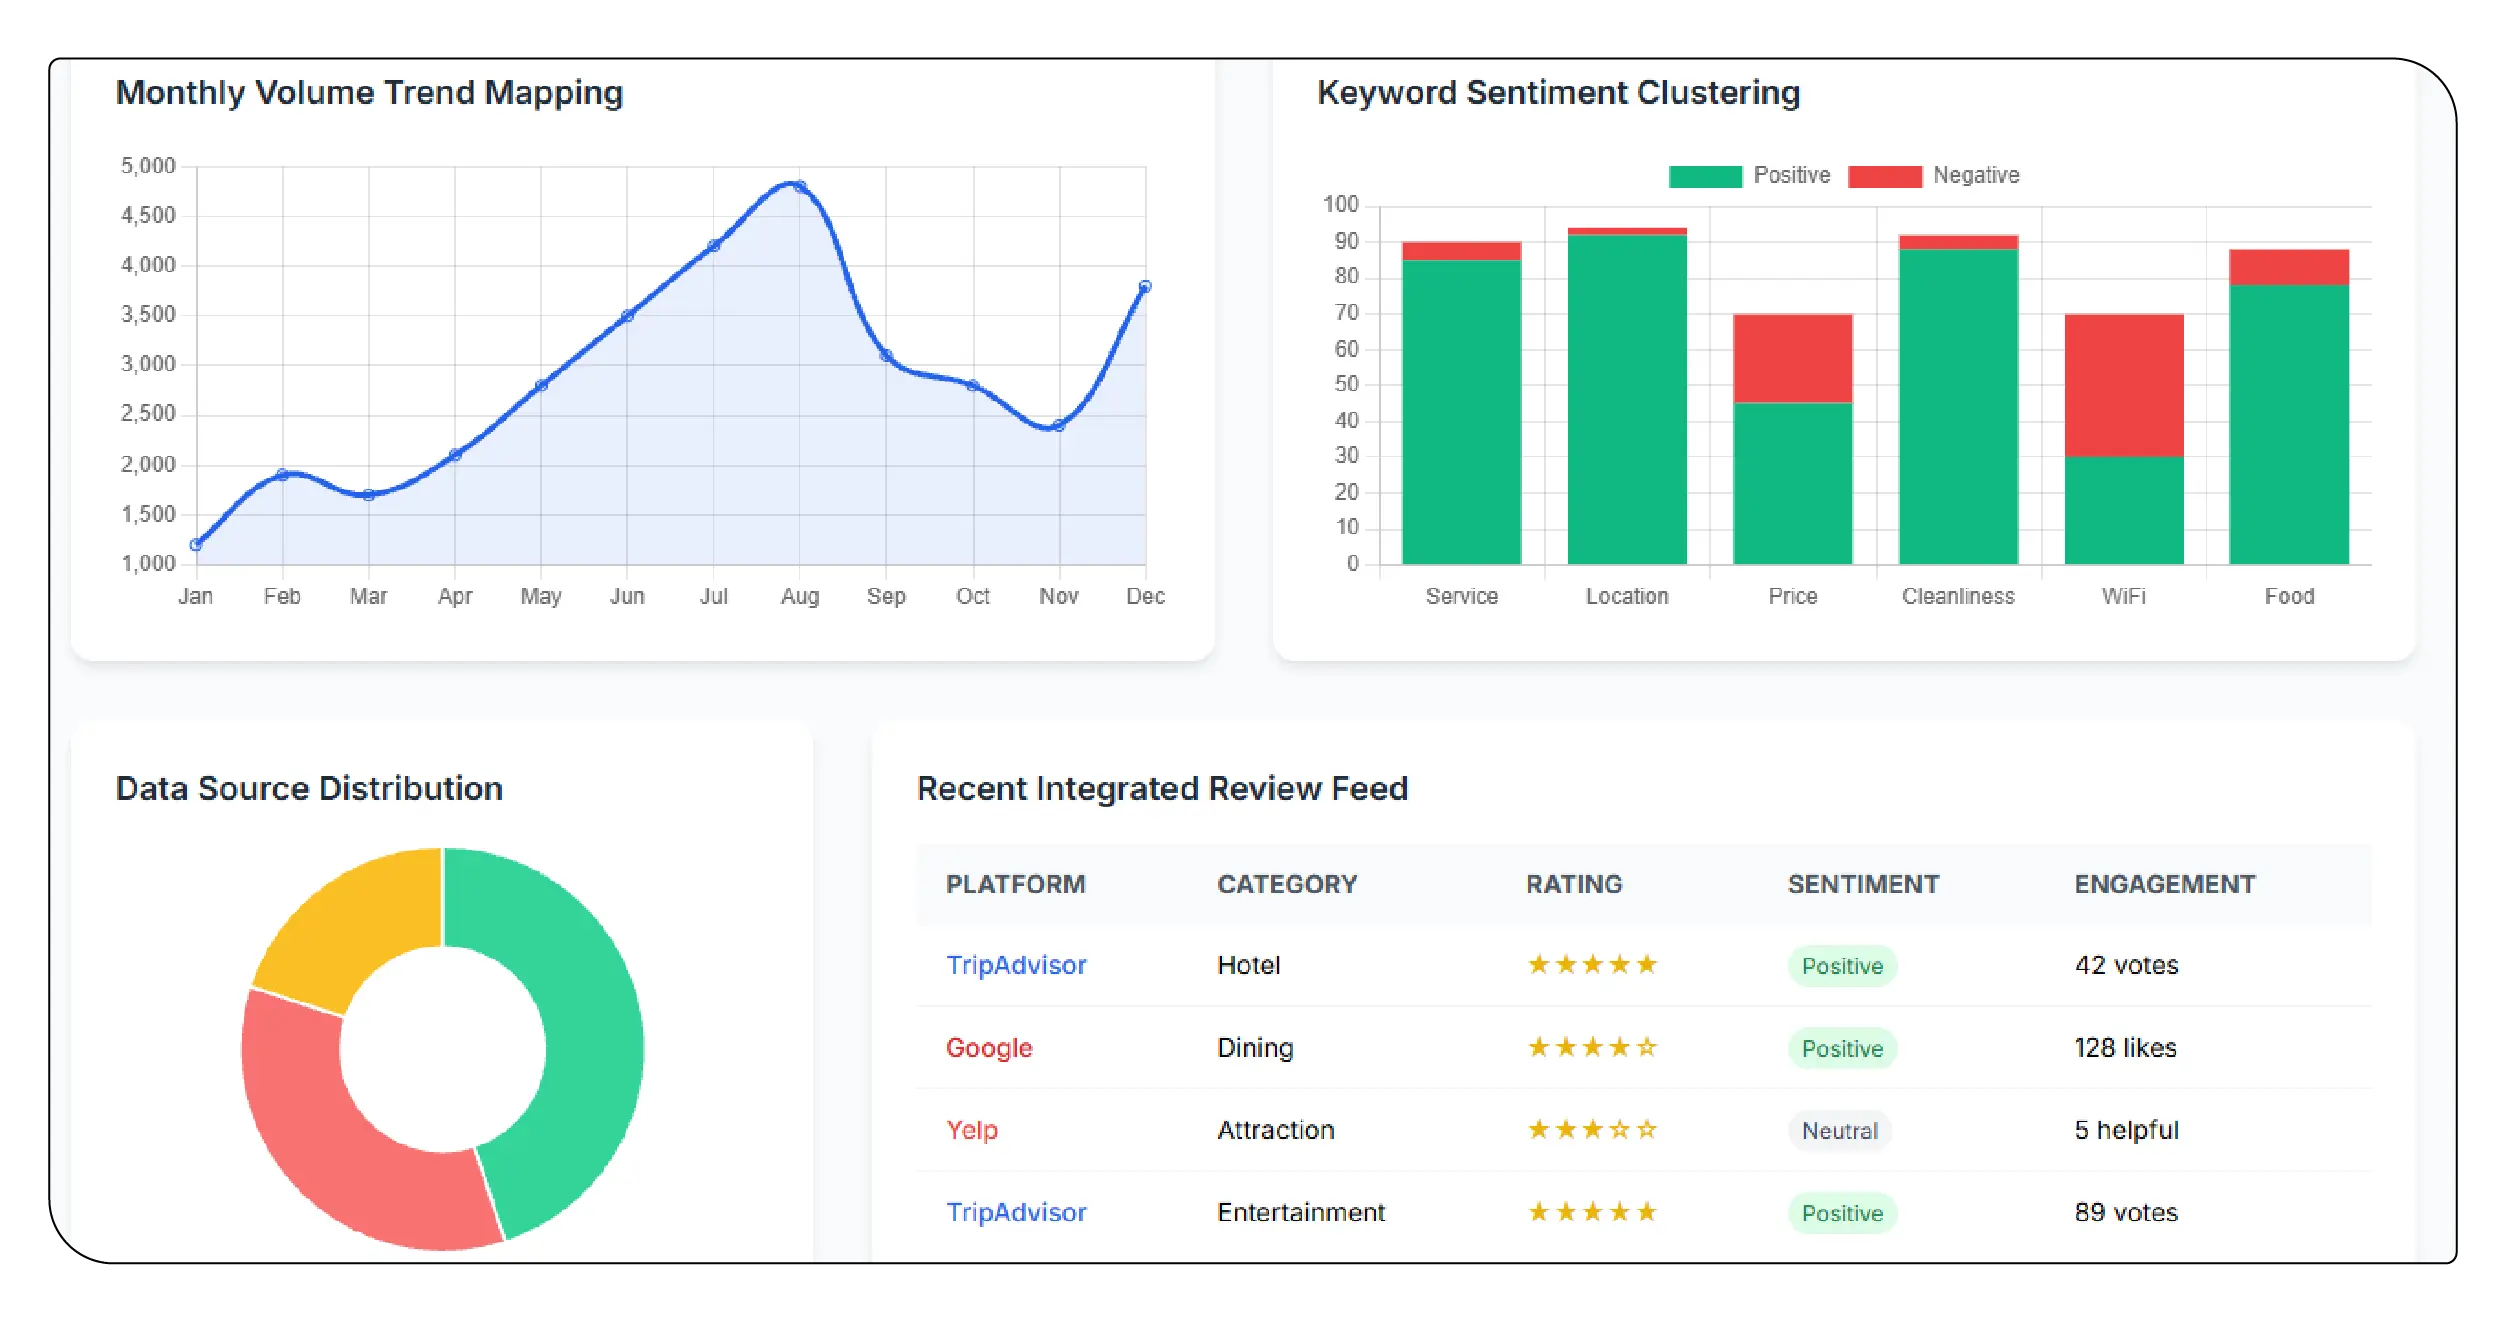
The analysis framework uses Travel Review Data Intelligence techniques including:
- Natural Language Processing (NLP)
- Sentiment scoring (positive, neutral, negative)
- Keyword clustering
- Monthly volume trend mapping
Additionally, Web Scraping Google tourism review data supports cross-platform rating comparison, especially for hotels and attractions indexed under Google Business listings.
A consolidated TripAdvisor Travel Reviews Dataset enhances global traveler insight, given TripAdvisor’s international user base.
City-Level Analysis
1. Cincinnati
State: Ohio
Country: United States
Tourism Profile
Cincinnati blends Midwestern charm with cultural attractions, sports tourism, riverfront entertainment, breweries, and museums. Key drivers include:
- Cincinnati Zoo & Botanical Garden
- Great American Ball Park
- Over-the-Rhine District
- Riverwalk tourism
Review Volume Overview
| Platform | Total Reviews (12 Months) | Avg Rating | Positive % | Neutral % | Negative % |
|---|---|---|---|---|---|
| Yelp | 18,450 | 4.2 | 74% | 14% | 12% |
| TripAdvisor | 12,870 | 4.3 | 76% | 13% | 11% |
| 36,920 | 4.4 | 79% | 11% | 10% | |
| Total | 68,240 | 4.3 | 76% Avg | 13% Avg | 11% Avg |
Key Sentiment Themes
| Category | Positive Mentions | Negative Mentions |
|---|---|---|
| Attractions | Family-friendly, clean facilities | Crowding during peak season |
| Dining | Craft breweries, diverse food scene | Parking issues, wait times |
| Hotels | Affordable pricing, river views | Outdated interiors in budget segments |
| Events | Sports atmosphere, festival vibrancy | Traffic congestion |
Insights
Cincinnati shows strong positive tourism sentiment driven by value-based travel, event tourism, and cultural offerings. Google dominates review volume, indicating high local and domestic visitor engagement.
Seasonal spikes appear between May–August and during baseball season (April–October).
2. Sevierville / Pigeon Forge
State: Tennessee
Country: United States
Tourism Profile
This region is a major family tourism hub centered around the Great Smoky Mountains National Park and Dollywood. It attracts high domestic vacation traffic.
Review Volume Overview
| Platform | Total Reviews (12 Months) | Avg Rating | Positive % | Neutral % | Negative % |
|---|---|---|---|---|---|
| Yelp | 15,780 | 4.1 | 71% | 16% | 13% |
| TripAdvisor | 21,450 | 4.4 | 82% | 10% | 8% |
| 58,200 | 4.5 | 84% | 9% | 7% | |
| Total | 95,430 | 4.3 | 79% Avg | 12% Avg | 9% Avg |
Key Sentiment Themes
| Category | Positive Mentions | Negative Mentions |
|---|---|---|
| Theme Parks | Family-friendly attractions, value packages | Long lines, peak pricing |
| Cabins/Lodging | Scenic mountain views, spacious cabins | Cleaning inconsistencies |
| Restaurants | Southern cuisine authenticity | Tourist pricing complaints |
| Entertainment | Live shows, Dollywood events | Ticket availability |
Insights
Sevierville/Pigeon Forge exhibits the highest review volume among analyzed cities, reflecting strong family tourism demand.
Google Reviews dominate due to attraction-based listings, while TripAdvisor remains influential among international visitors.
Peak review periods occur in summer months and holiday seasons (November–December).
3. Pinehurst
State: North Carolina
Country: United States
Tourism Profile
Pinehurst is renowned for golf tourism, luxury resorts, and upscale leisure travel. The demographic skews toward affluent travelers and event-based sports tourism.
Review Volume Overview
| Platform | Total Reviews (12 Months) | Avg Rating | Positive % | Neutral % | Negative % |
|---|---|---|---|---|---|
| Yelp | 4,950 | 4.3 | 77% | 13% | 10% |
| TripAdvisor | 8,120 | 4.6 | 88% | 7% | 5% |
| 14,340 | 4.7 | 90% | 6% | 4% | |
| Total | 27,410 | 4.5 | 85% Avg | 9% Avg | 6% Avg |
Key Sentiment Themes
| Category | Positive Mentions | Negative Mentions |
|---|---|---|
| Golf Courses | World-class greens, course maintenance | Premium pricing |
| Resorts | Luxury ambiance, attentive service | Limited nightlife options |
| Dining | Fine dining quality | Reservation difficulty |
| Events | Tournament organization excellence | Seasonal availability |
Insights
Pinehurst demonstrates lower volume but higher sentiment positivity. Reviews frequently mention service quality, exclusivity, and destination prestige.
Luxury positioning drives strong rating averages across all platforms.
Cross-City Comparative Analysis
| Metric | Cincinnati | Sevierville/PF | Pinehurst |
|---|---|---|---|
| Total Reviews | 68,240 | 95,430 | 27,410 |
| Avg Rating | 4.3 | 4.3 | 4.5 |
| Highest Volume Platform | |||
| Peak Season | Summer | Summer/Winter | Spring/Fall |
| Dominant Traveler Type | Urban Explorers | Family Travelers | Golf & Luxury Tourists |
Observations
- Sevierville leads in total review volume.
- Pinehurst leads in satisfaction score.
- Cincinnati shows balanced performance across attractions and dining.
- Google is the dominant review platform across all three cities.
The structured sentiment analysis of tourism reviews in the USA highlights geographic variation in traveler expectations:
- Family destinations generate higher volume but slightly higher negative feedback around crowding.
- Luxury destinations generate fewer but significantly more positive reviews.
- Urban destinations reflect mixed feedback due to infrastructure concerns.
Strategic Implications for Tourism Stakeholders
- Reputation Monitoring: Continuous cross-platform monitoring reduces brand risk.
- Seasonal Resource Planning: Review spikes align with staffing needs.
- Experience Enhancement: Keyword clusters reveal service gaps.
- Competitive Benchmarking: Cities can measure sentiment against peer destinations.
- Marketing Optimization: Positive themes inform ad campaigns.
Conclusion
This multi-city study demonstrates the strategic value of integrated review datasets in tourism intelligence. By combining Yelp, TripAdvisor, and Google reviews, stakeholders gain measurable insights into traveler sentiment and review volume patterns.
Cities like Sevierville benefit from high demand volume, while Pinehurst benefits from premium satisfaction levels. Cincinnati presents balanced urban tourism feedback with strong event-driven spikes.
Data-driven city-level tourism sentiment and demand analysis allows tourism boards and hospitality groups to identify operational strengths and areas requiring service improvement.
Organizations that strategically scrape tourism reviews from Yelp TripAdvisor and Google can unify fragmented feedback into structured analytics dashboards for ongoing decision-making.
Integration with resources such as the Google Hotel Search Travel Reviews Dataset further enhances hotel-specific benchmarking and price-to-sentiment correlations.
In an increasingly competitive U.S. tourism landscape, review intelligence is no longer optional—it is foundational to strategic planning, reputation management, and destination growth forecasting.
Ready to elevate your travel business with cutting-edge data insights? Scrape Aggregated Flight Fares to identify competitive rates and optimize your revenue strategies efficiently. Discover emerging opportunities with tools to Extract Travel Website Data, leveraging comprehensive data to forecast market shifts and enhance your service offerings. Real-Time Travel App Data Scraping Services helps stay ahead of competitors, gaining instant insights into bookings, promotions, and customer behavior across multiple platforms. Get in touch with Travel Scrape today to explore how our end-to-end data solutions can uncover new revenue streams, enhance your offerings, and strengthen your competitive edge in the travel market.
Unlock the Full Report
Enter your details to access premium pricing intelligence insights