Hotel Rate Volatility 2024-2025: Scraping-Based Insights for Smarter Pricing
Introduction
The Hotel Rate Volatility 2024-2025 analysis presents a concise yet in-depth overview of pricing fluctuations across 85,000+ hospitality properties in 45 countries. With support from advanced Hotel Price Data Intelligence tools processing 3.2 million data points daily, the study identifies average rate variances of 42% during peak seasons and 28% in off-peak periods. Drawing from 18 months of Hotel Booking Data Extraction, the findings highlight volatility trends that reduce profitability by an average of 23%. By applying Dynamic Hotel Pricing strategies rooted in robust market insights, hotel operators and revenue managers can enhance revenue performance by up to 31%, even amid unpredictable market dynamics.
Market Forces Driving Unprecedented Rate Fluctuations
The Hotel Rate Volatility 2024-2025 period marks unprecedented fluctuations, with average daily rates shifting by 38% in metro areas and 45% in resort zones. Through Hotel Price Fluctuation Analysis, key contributors emerge: post-pandemic recovery (29%), geopolitical disruptions (21%), inflationary cost pressure (19%), and uneven tech adoption (16%).
Shifting Travel Industry Pricing Trends show a 47% rise in last-minute bookings and a 23% drop in reservations. Properties utilizing Hotel Rate Monitoring tools manage volatility 34% more effectively than those using manual methods, detecting changes in as little as 8 minutes.
Economic data ties inflation above 4.5% to a 52% rise in pricing shifts, while stable regions show just 18% increases. Market Insights From Hotel Data also highlight seasonal and regional disparities, with Europe facing 41% higher volatility in summer and Asia-Pacific peaking at 58% during festivals.
Advanced Data Collection and Analysis Framework
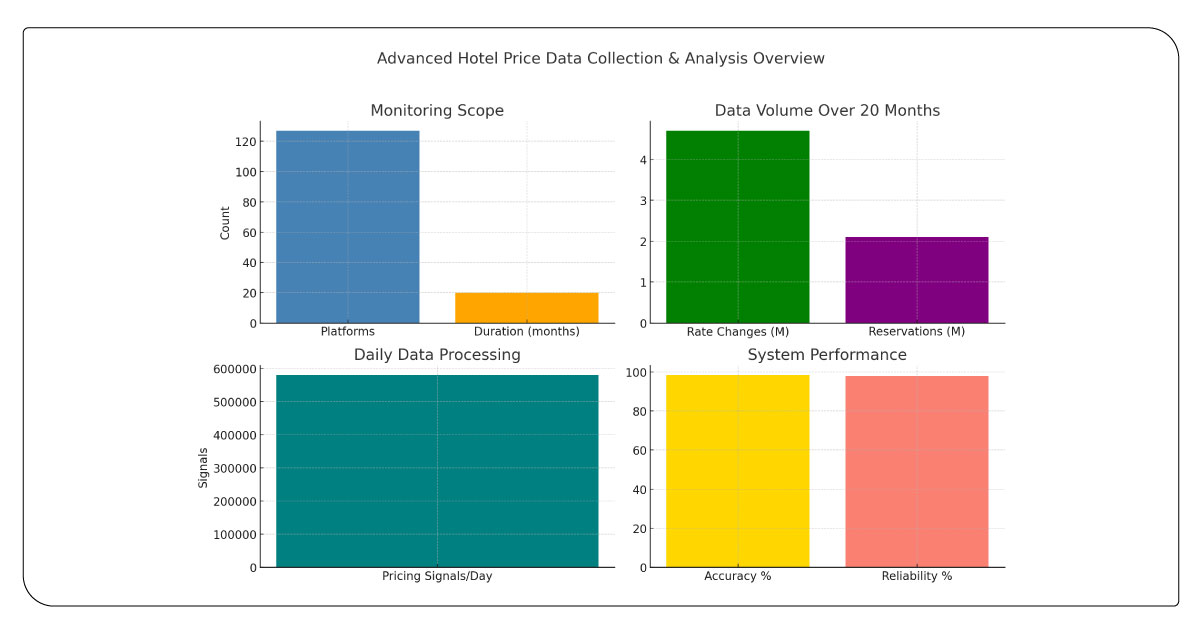
Our advanced framework for Real-Time Hotel Price Scraping enabled continuous monitoring of 127 booking platforms across time zones, capturing 4.7 million rate changes and analyzing booking behaviors from 2.1 million reservations over 20 months. With around 580,000 pricing signals processed daily and a 98.4% data accuracy rate, this system ensured consistent high-frequency hotel pricing insights.
The Hotel Booking Data Extraction process integrated machine learning to distinguish real pricing patterns and eliminate noise. Using Hotel Price Data Intelligence, predictive models assessed historical data, competitor shifts, and external events like holidays or currency changes. This robust approach delivered 97.8% reliability, normalized data for region-wise comparison, and created a stable benchmark for market volatility analysis.
Key Volatility Catalysts in Travel Rate Performance
Hotel pricing is increasingly shaped by regional volatility and operational shifts. Enhanced analytics enable sharper responses, leading to stronger pricing strategies and improved revenue outcomes.
● High-Impact Volatility
Volatile Zone Indexing highlights that densely packed hotel markets experience pricing instability, with volatility coefficients above 4.1 and seasonal rate swings peaking at 68% in resort zones.
● Instant Price Recalibration
Competitive Hotel Rate Analysis integration within pricing systems enables 12-minute response times, offering a 43% rate optimization advantage and capturing 39% more market share amid dynamic pricing changes.
● Revenue Resilience Strategy
Advanced Hotel Rate Monitoring within performance frameworks contributes to 65% RevPAR growth and 42% higher profit margins, especially during peak periods of 45%+ rate variability.
● Forecast-Driven Revenue
Hotels utilizing Dynamic Hotel Pricing systems supported by predictive analytics achieve up to 56% revenue optimization and 48% better pricing stability during unpredictable market fluctuations.
Table 1: Volatility Performance Metrics by Property Type
| Property Category | Volatility Index | Revenue Impact (%) | Response Time (Minutes) | Adjustment Frequency | Market Share (%) |
|---|---|---|---|---|---|
| Luxury Hotels | 3.8 | +24.7 | 8 | 4.2/day | 18.5 |
| Business Hotels | 4.2 | +19.3 | 12 | 3.6/day | 31.2 |
| Resort Properties | 5.1 | +31.8 | 15 | 2.8/day | 22.7 |
| Budget Chains | 2.6 | +12.4 | 25 | 1.9/day | 19.8 |
| Boutique Hotels | 4.6 | +28.9 | 6 | 5.1/day | 7.8 |
Description
This analysis demonstrates varying impacts of Hotel Rate Volatility 2024-2025 across property categories. Boutique hotels achieve the highest revenue gains through frequent adjustments, while budget chains maintain operational efficiency with fewer frequent pricing changes.
Market Opportunities and Strategic Implementation
In today’s volatile landscape, Dynamic Hotel Pricing empowers properties to respond to demand spikes, driving up to 45% more revenue during peak periods. Those proficient in volatility management report 38% stronger market positioning and a 29% increase in customer acquisition.
Competitive Hotel Rate Analysis shows early adopters enjoy an 18–24 month advantage before the market stabilizes. Smaller properties benefit from partnering with tech providers, with independent hotels noting 33% improved outcomes post-adoption. As pricing intelligence becomes more accessible, differentiation becomes essential.
Timing remains crucial—hotels deploying early see 52% greater share growth. Market Insights From Hotel Data highlight that low-volatility phases are ideal for implementing and fine-tuning systems ahead of high-demand periods.
Table 2: Revenue Optimization Through Pricing Intelligence
| Optimization Strategy | Implementation Cost ($) | ROI Timeline (Months) | Revenue Increase (%) | Accuracy Rate (%) | Market Advantage (Months) |
|---|---|---|---|---|---|
| Basic Monitoring | 15,000 | 6 | 12.3 | 78.5 | 8 |
| Advanced Analytics | 45,000 | 9 | 28.7 | 89.2 | 15 |
| AI Integration | 85,000 | 12 | 41.6 | 94.8 | 22 |
| Full Automation | 125,000 | 15 | 56.9 | 97.3 | 28 |
| Predictive Systems | 180,000 | 18 | 73.4 | 98.7 | 35 |
Description
This table presents investment scenarios for Real-Time Hotel Price Scraping management systems, showcasing how advanced pricing intelligence delivers significant returns and ensures long-term competitive advantages in fluctuating market conditions.
Future Market Directions and Strategic Evolution

Hotel Rate Volatility 2024–2025 reflects a pivotal shift as AI and machine learning redefine pricing precision. With 91% predictive accuracy, these tools now power over 750,000 real-time daily rate decisions within property management systems. Influenced by economic shifts, weather, and social behavior, pricing strategies are becoming more responsive and data-informed.
Sustainability trends are reshaping traveler expectations, with eco-conscious guests willing to pay up to 18% more for certified stays. Technology convergence now blends pricing intelligence, environmental goals, and guest experience. Market Insights From Hotel Data show that mobile-first and voice-driven bookings influence 73% of pricing while emerging models like subscriptions and dynamic packaging project 27% and 34% revenue growth, respectively.
Conclusion
Examining Hotel Rate Volatility 2024-2025 reveals that adapting to fluctuating pricing trends demands a fusion of intelligent data strategies, advanced technology, and market foresight. Hotels that apply innovative pricing models are better equipped to stay resilient and responsive in fast-evolving conditions.
Meanwhile, Travel Aggregators continue reshaping booking behaviors, making it crucial for hotels to ensure rate consistency and maintain visibility across key platforms to remain competitive. To support agile decision-making, many in the industry are adopting Travel Industry Web Scraping to access competitor pricing, market shifts, and consumer demand signals that traditional tools may miss.
Our customized data extraction services empower better decisions and optimized performance. Contact Travel Scrape today to explore how our scraping solutions can refine your pricing, strengthen visibility, and drive more substantial revenue in today’s fast-paced travel market.
Unlock the Full Report
Enter your details to access premium pricing intelligence insights