Airline Ticket Price Scraping Panel Data Analysis Across Routes, Airlines, and Booking Periods

Introduction
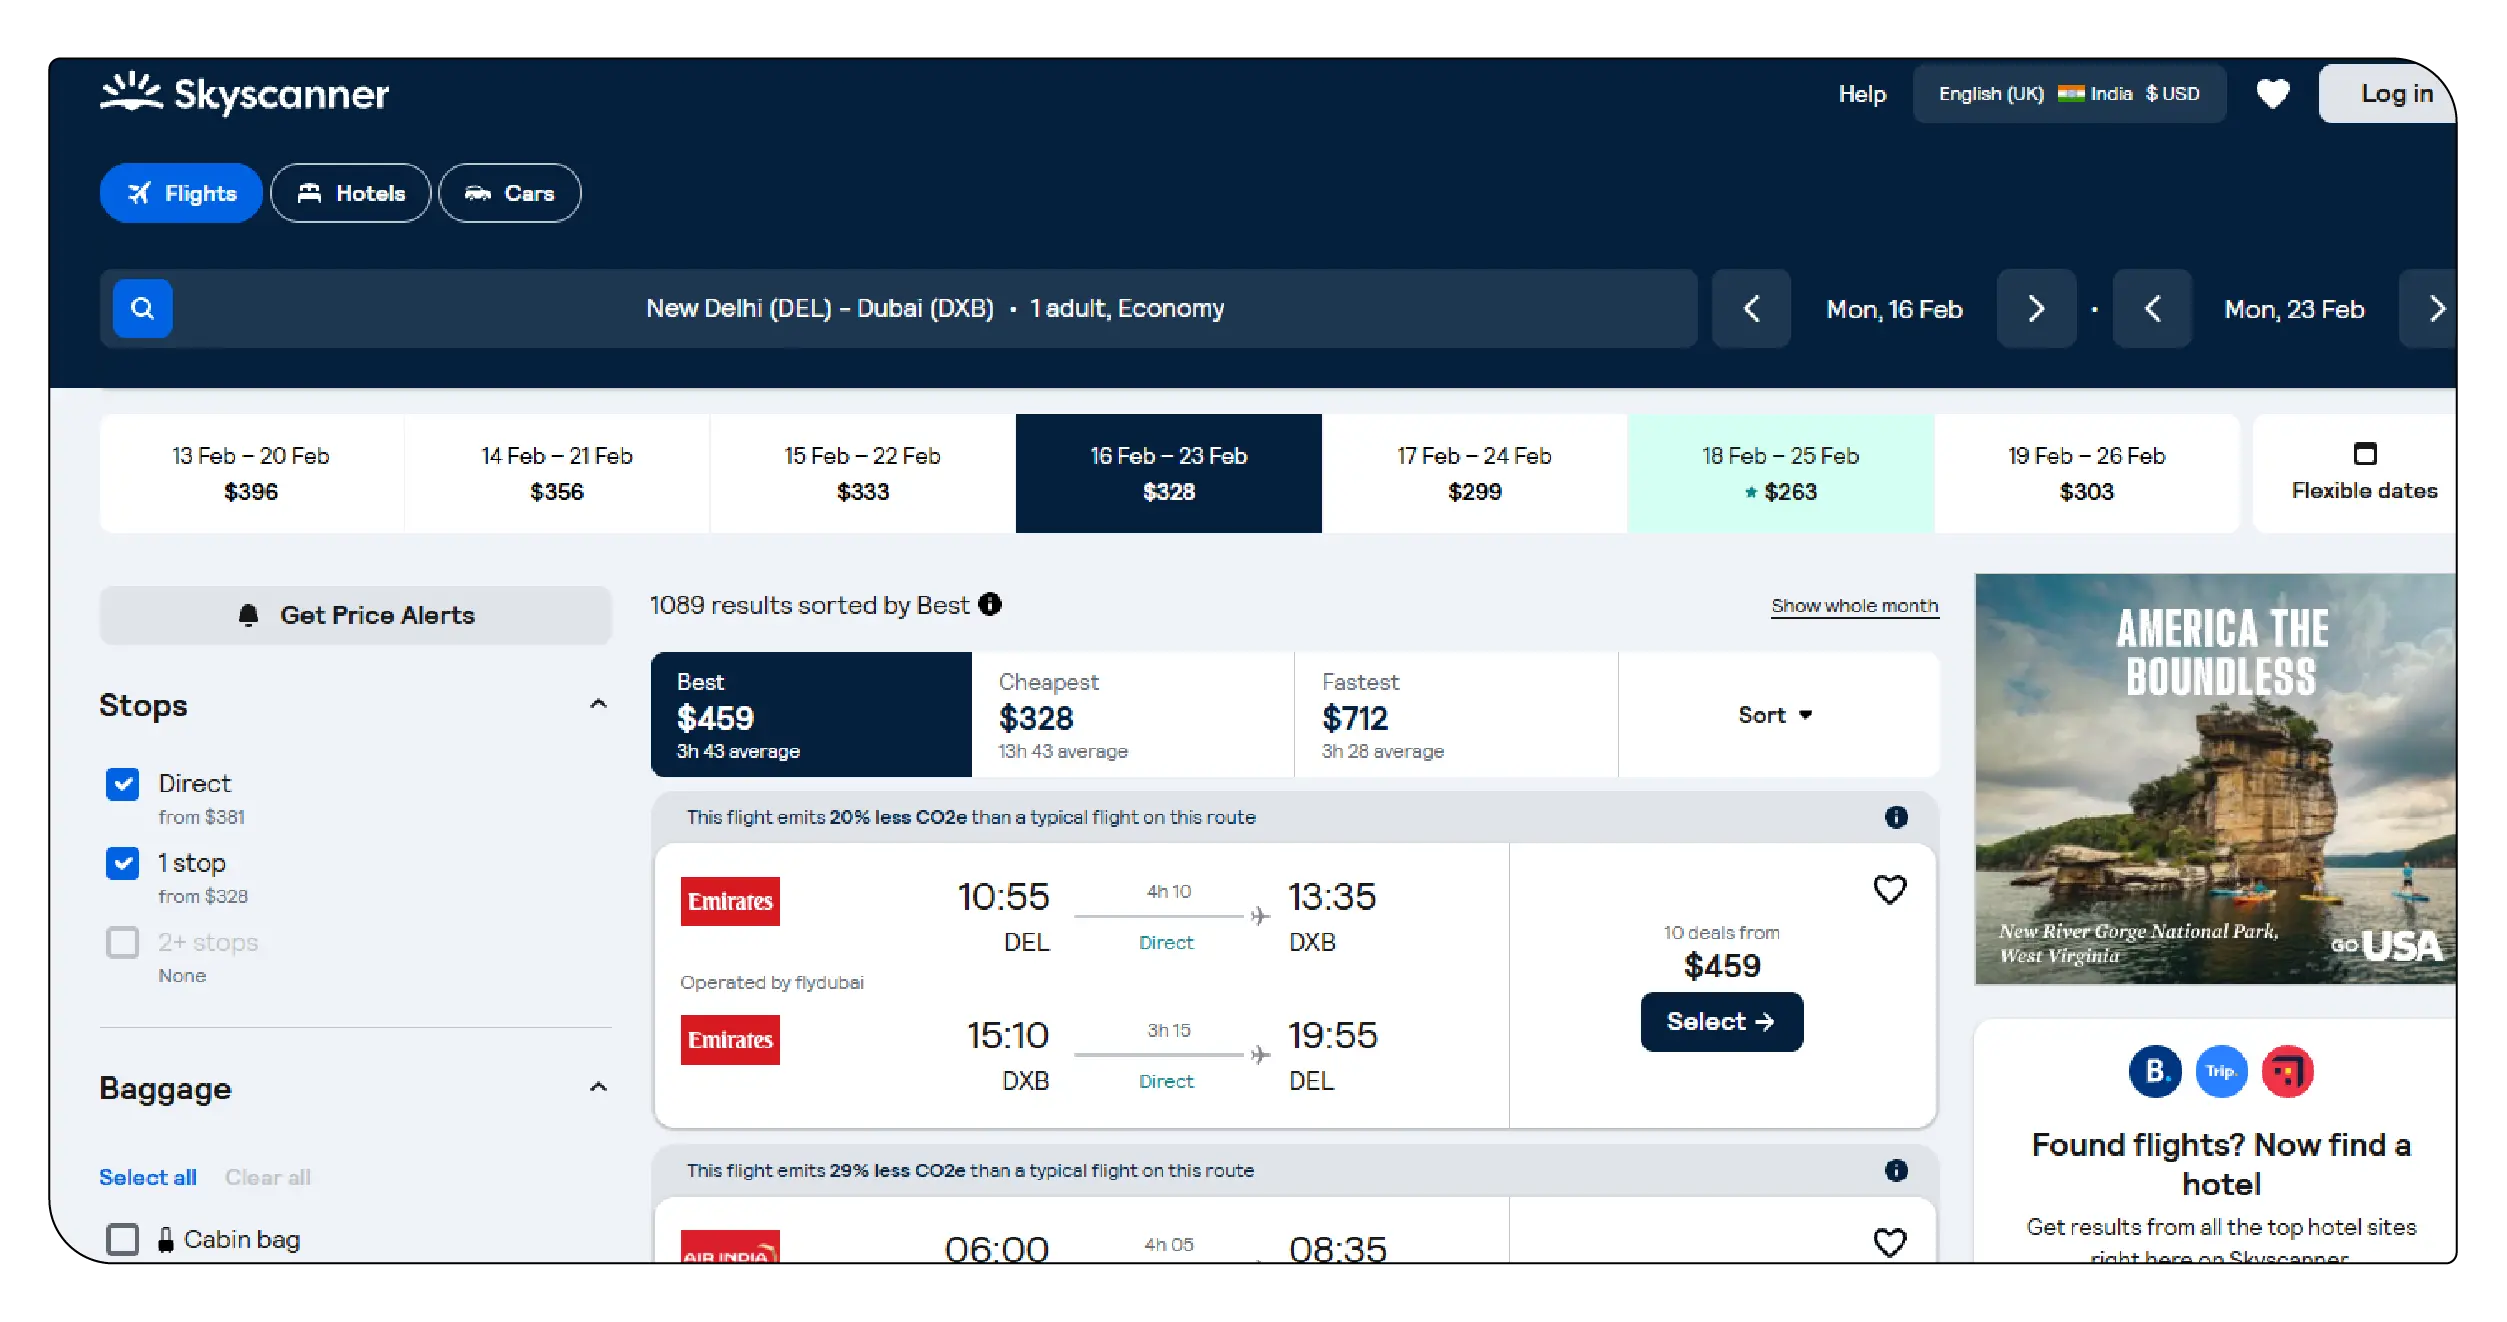
The aviation industry operates in a highly dynamic pricing environment where ticket prices change multiple times a day based on demand, seat inventory, competition, seasonality, and booking windows. To systematically evaluate these variations, researchers and businesses increasingly rely on Airline Ticket Price Scraping Panel Data Analysis as a structured approach to monitor fare changes across multiple dimensions.
A comprehensive study begins with building a structured Global Flight Schedule Dataset, combining route information, airline operators, departure timings, and seat classes.
Advanced techniques in web scraping flight Ticket prices data enable automated collection of fare information from airline websites and online travel agencies at scale.
This research report explores how scraped airline ticket prices can be transformed into panel datasets for route-level, airline-level, and booking-period-level econometric analysis.
Conceptual Framework of Panel Data in Airline Pricing
Panel data refers to multi-dimensional datasets that track multiple entities over time. In airline pricing research, panel data can be structured as:
- Cross-sectional units: Routes (e.g., DEL–DXB, NYC–LHR), Airlines (Emirates, Air India, Lufthansa), Booking windows (90 days before departure, 60 days, etc.)
- Time dimension: Daily or hourly observations
A panel dataset allows analysts to observe:
- Inter-airline price competition
- Intra-route fare volatility
- Impact of booking lead time on fares
- Seasonal and event-driven pricing shifts
Unlike cross-sectional analysis, panel models control for unobserved heterogeneity across airlines and routes.
Data Collection Methodology
Data Sources
Airline pricing data is typically collected from:
- Airline official websites
- Online travel aggregators
- Metasearch engines
- Mobile applications
The process of Airfare Fluctuation Data Scraping involves automated crawling at predefined intervals (e.g., every 6 hours).
Data Attributes Captured
Each record includes:
| Attribute | Description |
|---|---|
| Route | Origin–Destination Pair |
| Airline | Operating Carrier |
| Booking Date | Date of Price Collection |
| Departure Date | Flight Date |
| Days to Departure | Booking Window |
| Cabin Class | Economy, Business |
| Base Fare | Ticket Price |
| Taxes & Fees | Additional Charges |
| Total Fare | Final Price |
Such structured extraction enables advanced airline ticket price panel data analysis for econometric modeling.
Sample Route-Level Panel Dataset
Below is a representative long-form dataset illustrating daily fare tracking across airlines and booking windows.
Route-Level Daily Fare Observations (Economy Class, USD)
| Route | Airline | Booking Window (Days) | Day 1 | Day 2 | Day 3 | Day 4 | Day 5 |
|---|---|---|---|---|---|---|---|
| DEL–DXB | Emirates | 90 | 320 | 315 | 318 | 325 | 330 |
| DEL–DXB | Air India | 90 | 295 | 300 | 305 | 310 | 315 |
| DEL–DXB | IndiGo | 90 | 280 | 275 | 278 | 285 | 290 |
| NYC–LHR | British Airways | 60 | 720 | 710 | 730 | 740 | 750 |
| NYC–LHR | Virgin Atlantic | 60 | 690 | 700 | 710 | 715 | 720 |
| NYC–LHR | Delta | 60 | 705 | 695 | 710 | 720 | 735 |
| SYD–SIN | Qantas | 45 | 480 | 470 | 465 | 475 | 490 |
| SYD–SIN | Singapore Airlines | 45 | 510 | 505 | 500 | 520 | 525 |
This structure supports route-wise competitive comparison.
Booking Window Analysis
Booking period tracking is critical to understanding pricing curves. The technique of booking period flight price data scraping enables researchers to build advance-purchase models.
Average Fare by Booking Window (DEL–DXB, USD)
| Booking Window | Emirates | Air India | IndiGo | Route Average |
|---|---|---|---|---|
| 120 Days | 290 | 270 | 250 | 270 |
| 90 Days | 320 | 300 | 280 | 300 |
| 60 Days | 350 | 330 | 310 | 330 |
| 30 Days | 420 | 390 | 360 | 390 |
| 14 Days | 520 | 490 | 460 | 490 |
| 7 Days | 610 | 580 | 540 | 577 |
Findings:
- Prices rise non-linearly as departure approaches.
- Low-cost carriers exhibit smaller but still significant upward shifts.
- Fare acceleration becomes steep within 14 days.
Airline-Level Competitive Dynamics
Using structured route-wise flight price data scraping, analysts can compare airlines across markets.
Multi-Route Airline Price Comparison (60-Day Window, USD)
| Airline | DEL–DXB | NYC–LHR | SYD–SIN | BOM–BKK | Average Fare |
|---|---|---|---|---|---|
| Emirates | 350 | 750 | 610 | 400 | 528 |
| Air India | 330 | 710 | 580 | 370 | 498 |
| British Airways | 360 | 740 | 600 | 390 | 523 |
| Singapore Airlines | 355 | 730 | 620 | 395 | 525 |
| Low-Cost Carrier Avg | 310 | 690 | 540 | 350 | 473 |
Panel regression reveals:
- Premium airlines maintain 5–12% price premium.
- Fare gaps narrow during low-demand seasons.
- Competitive convergence occurs when seat load factors exceed 85%.
Econometric Modeling Approaches
Panel data models include:
- Fixed Effects Models
- Random Effects Models
- Dynamic Panel Models
- Difference-in-Differences
The Global Flight Price Trends Dataset constructed from multi-route scraping supports:
- Elasticity estimation
- Impact of fuel price shocks
- Event-based fare shifts
- Seasonal volatility modeling
Seasonal and Event-Based Price Volatility
Using large-scale datasets generated through Airline Data Scraping Services, analysts can detect patterns such as:
- Holiday surge pricing
- Weekend vs weekday fare differences
- Festival-based route spikes (e.g., Diwali, Christmas)
- Major sports event pricing surges
Seasonal Fare Comparison (NYC–LHR, USD)
| Season | Average Fare (60-Day Window) | Std. Deviation | Peak Fare |
|---|---|---|---|
| Winter | 680 | 45 | 820 |
| Spring | 710 | 50 | 860 |
| Summer | 890 | 120 | 1250 |
| Autumn | 730 | 60 | 900 |
Summer volatility is highest due to tourism and school holidays.
Advanced Data Architecture
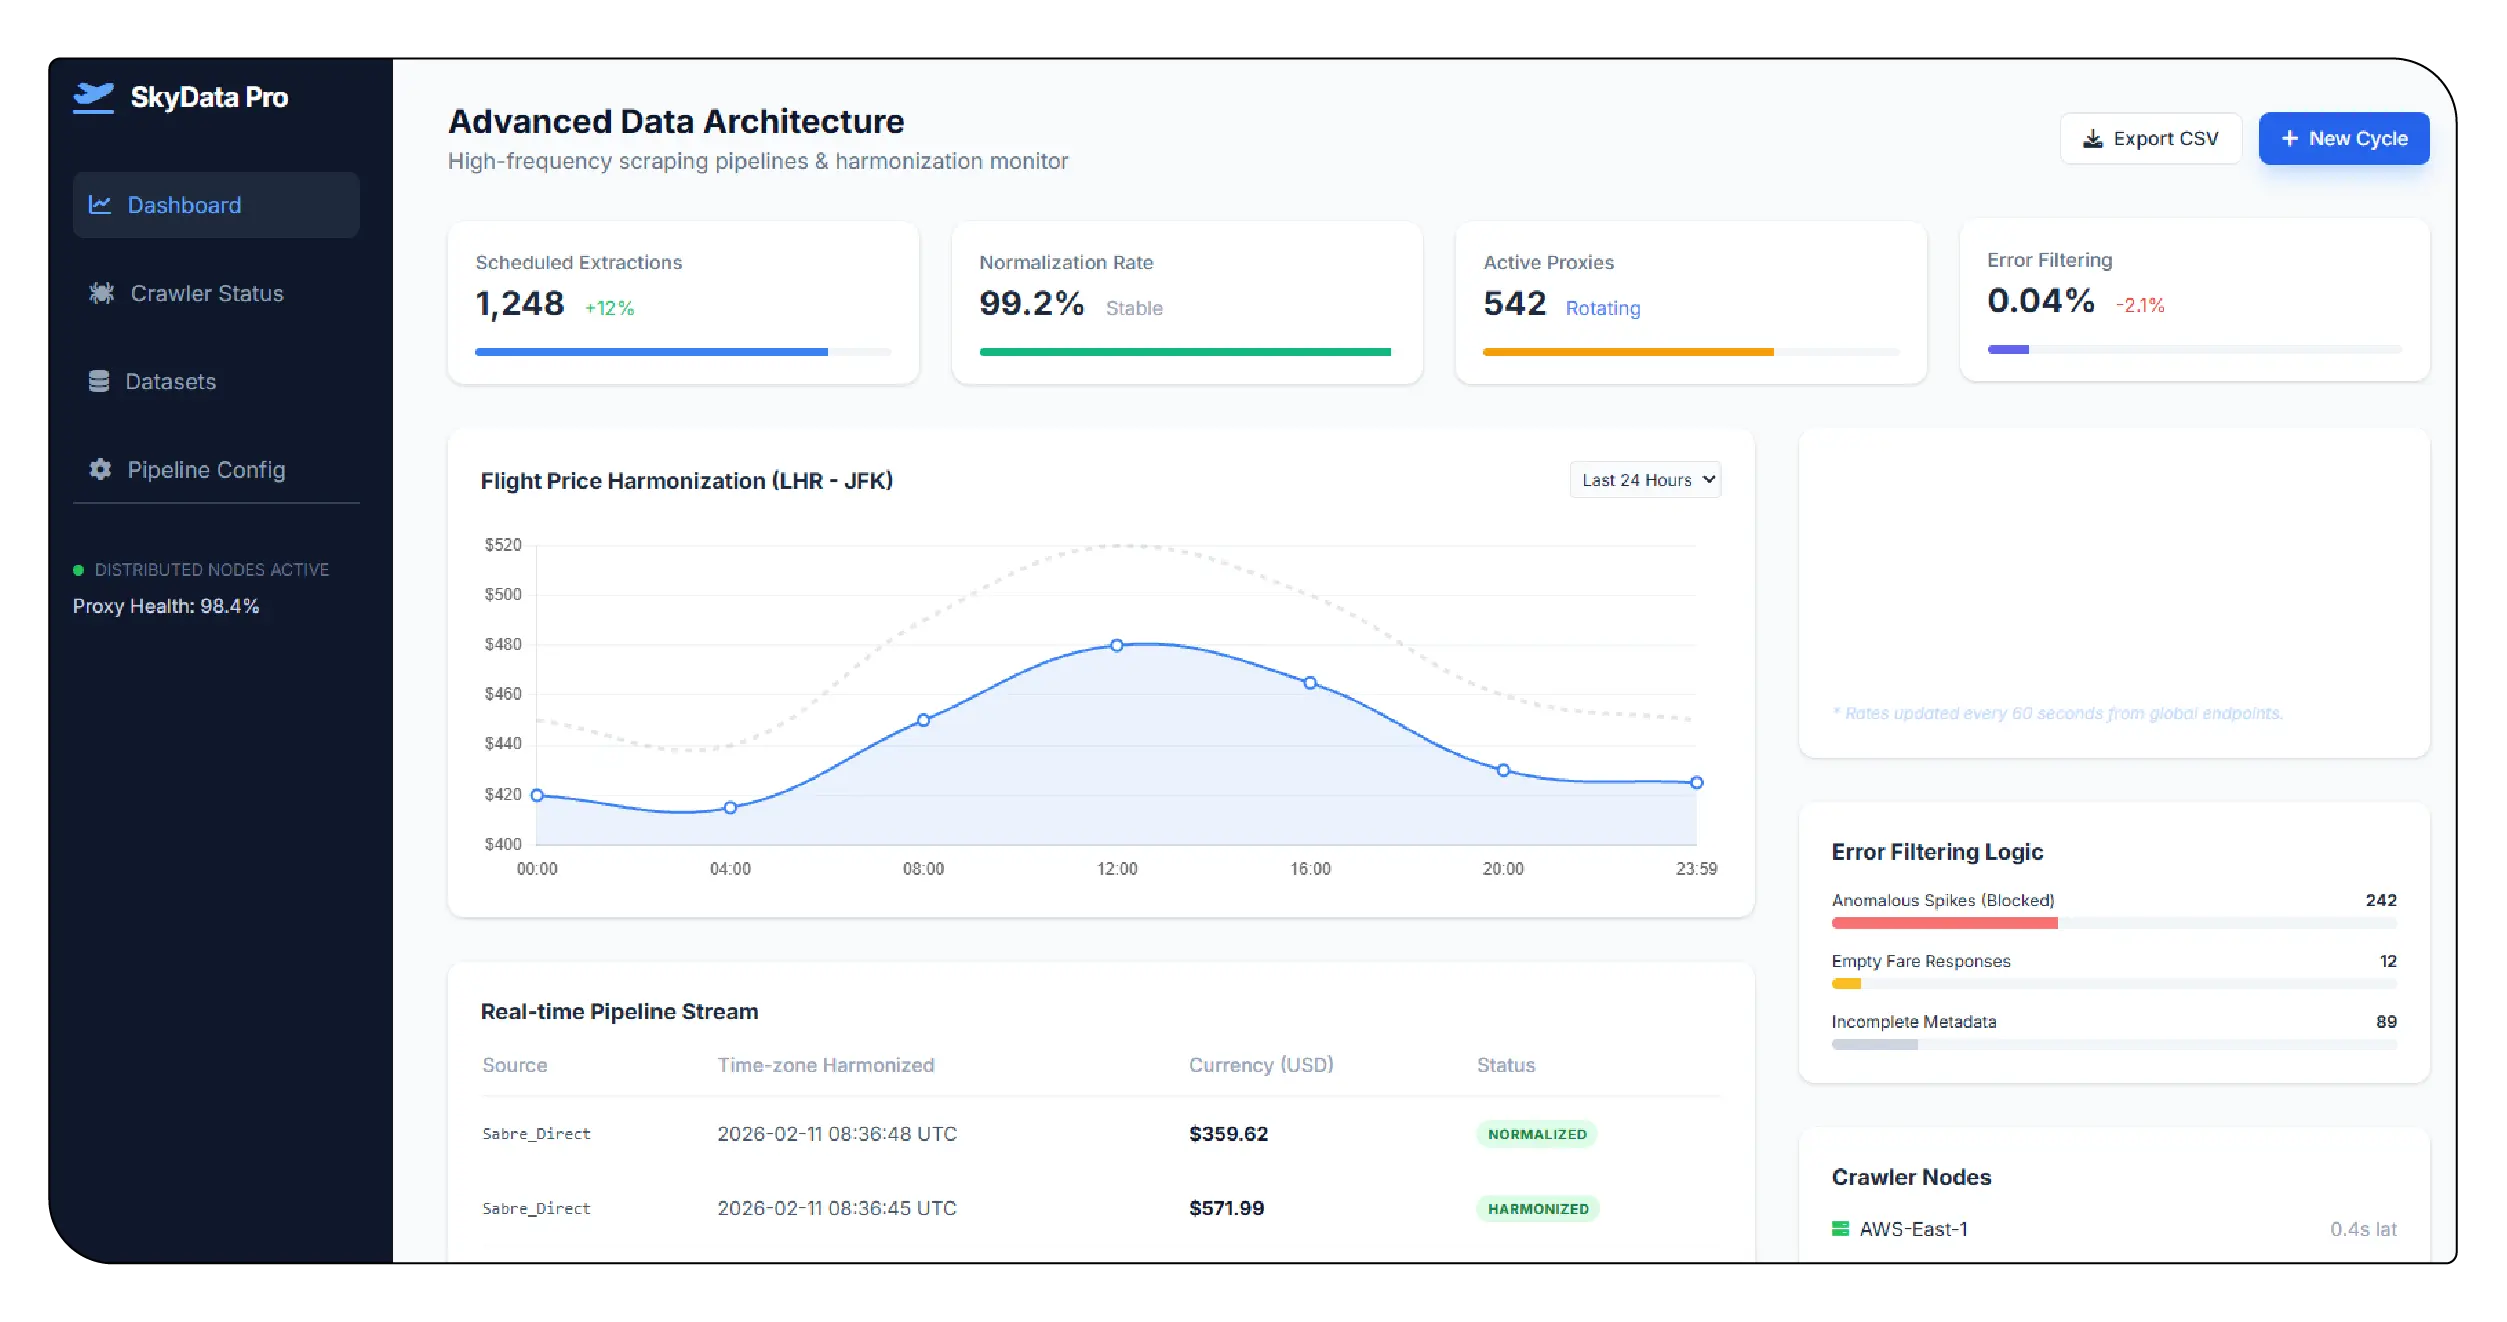
High-frequency scraping pipelines use distributed crawlers and proxy rotation to avoid blocking. The process of building robust datasets involves:
- Scheduled extraction cycles
- Data normalization
- Currency conversion
- Time-zone harmonization
- Error filtering
Such processes enhance Flight Price Data Intelligence capabilities for businesses and researchers.
Business Applications
Airlines
- Revenue management optimization
- Competitive response modeling
- Dynamic pricing recalibration
Travel Agencies
- Fare alert systems
- Arbitrage detection
- Cross-market price comparison
Researchers
- Studying price discrimination
- Market concentration analysis
- Collusion detection
The scalability of automated scraping enables continuous monitoring across hundreds of routes.
Challenges in Airline Ticket Scraping
- Dynamic JavaScript rendering
- CAPTCHA and bot detection
- Frequent website structure changes
- Geo-location pricing variations
- Personalized pricing experiments
Advanced automation frameworks mitigate these barriers through adaptive crawling and intelligent parsing systems.
Data Volume and Scale Example
A typical multi-route scraping study:
- 150 Routes
- 25 Airlines
- 180 Booking Windows
- 120 Days of Observation
Total Observations:
150 × 25 × 180 × 120 = 81,000,000 fare records
Such scale enables granular statistical inference.
Key Research Insights
From large-scale panel datasets:
- Fare dispersion increases closer to departure.
- Premium carriers sustain higher average margins.
- International long-haul routes show greater volatility.
- Low-cost carriers react faster to competitor fare drops.
- Advance purchase discounts vary significantly across regions.
Conclusion
Airline pricing is one of the most sophisticated dynamic pricing systems globally. Through structured scraping frameworks and panel dataset construction, researchers gain powerful visibility into cross-route and cross-airline price behavior. The integration of booking windows, route characteristics, and airline attributes enables deep route airline booking window airfare analysis across international markets.
Systematic extraction Flight Ticket Price data allows longitudinal modeling of fare dispersion, seasonality, and competition intensity.
Future systems integrating machine learning with a Real-Time Flight Data Scraping API will enhance predictive fare analytics, enabling dynamic forecasting, anomaly detection, and automated revenue strategy simulation.
As aviation markets grow increasingly competitive, high-quality airline fare panel datasets will remain central to empirical research, regulatory oversight, and strategic airline revenue management.
Ready to elevate your travel business with cutting-edge data insights? Scrape Aggregated Flight Fares to identify competitive rates and optimize your revenue strategies efficiently. Discover emerging opportunities with tools to Extract Travel Website Data, leveraging comprehensive data to forecast market shifts and enhance your service offerings. Real-Time Travel App Data Scraping Services helps stay ahead of competitors, gaining instant insights into bookings, promotions, and customer behavior across multiple platforms. Get in touch with Travel Scrape today to explore how our end-to-end data solutions can uncover new revenue streams, enhance your offerings, and strengthen your competitive edge in the travel market.
Unlock the Full Report
Enter your details to access premium pricing intelligence insights