Bengaluru Luxury Hotel Rate Parity Analysis: Ritz-Carlton, JW Marriott, ITC Gardenia, Taj West End & The Oberoi (June–July 2026)
Introduction
Bengaluru's luxury hotel market combines strong corporate travel demand, premium leisure stays, conferences, weddings, technology-sector travel, and international business traffic. As guests increasingly compare direct hotel websites with OTAs, metasearch engines, loyalty channels, and mobile booking applications, maintaining consistent pricing across channels has become an important revenue-management consideration.
Bengaluru Luxury Hotel Rate Parity Analysis evaluates how room prices, taxes, inclusions, cancellation policies, room categories, and booking conditions differ across major distribution channels.
Rate Parity Monitoring provides a structured way to identify where comparable rooms are offered at different effective prices and whether differences are caused by genuine package variations, member rates, promotions, taxes, or potential channel inconsistencies.
Bengaluru luxury hotel rate comparison dataset can combine property-level, room-level, date-level, channel-level, and booking-condition information to create a continuously updated competitive pricing intelligence layer.
The market includes prominent properties such as The Ritz-Carlton, Bangalore, JW Marriott Hotel Bengaluru, ITC Gardenia, Taj West End, The Oberoi Bengaluru, and other premium properties. Marriott's current Bengaluru hotel listings, for example, show different displayed nightly prices for ITC Gardenia, JW Marriott Hotel Bengaluru, and The Ritz-Carlton depending on the searched stay dates and booking environment.
The purpose of parity analysis is therefore not simply to identify the cheapest listing. It is to determine whether apparently different prices represent genuinely comparable offers.
What Is Hotel Rate Parity?
Hotel rate parity refers to the consistency of a comparable room offer across distribution channels. A meaningful comparison requires more than matching the property name and room category.
For example, a ₹25,000 room on one platform and a ₹27,000 room on another may initially appear to represent a ₹2,000 parity gap. However, the second offer could include breakfast, flexible cancellation, airport transfer, loyalty benefits, or a different tax treatment.
A robust rate-parity model therefore normalizes:
- Room category
- Occupancy
- Stay dates
- Number of nights
- Cancellation terms
- Meal inclusions
- Taxes and fees
- Currency
- Promotional discounts
- Loyalty/member pricing
- Mobile-only pricing
- Payment conditions
- Advance-purchase restrictions
This produces an effective comparable rate rather than relying on the headline room price.
Bengaluru's Luxury Pricing Environment
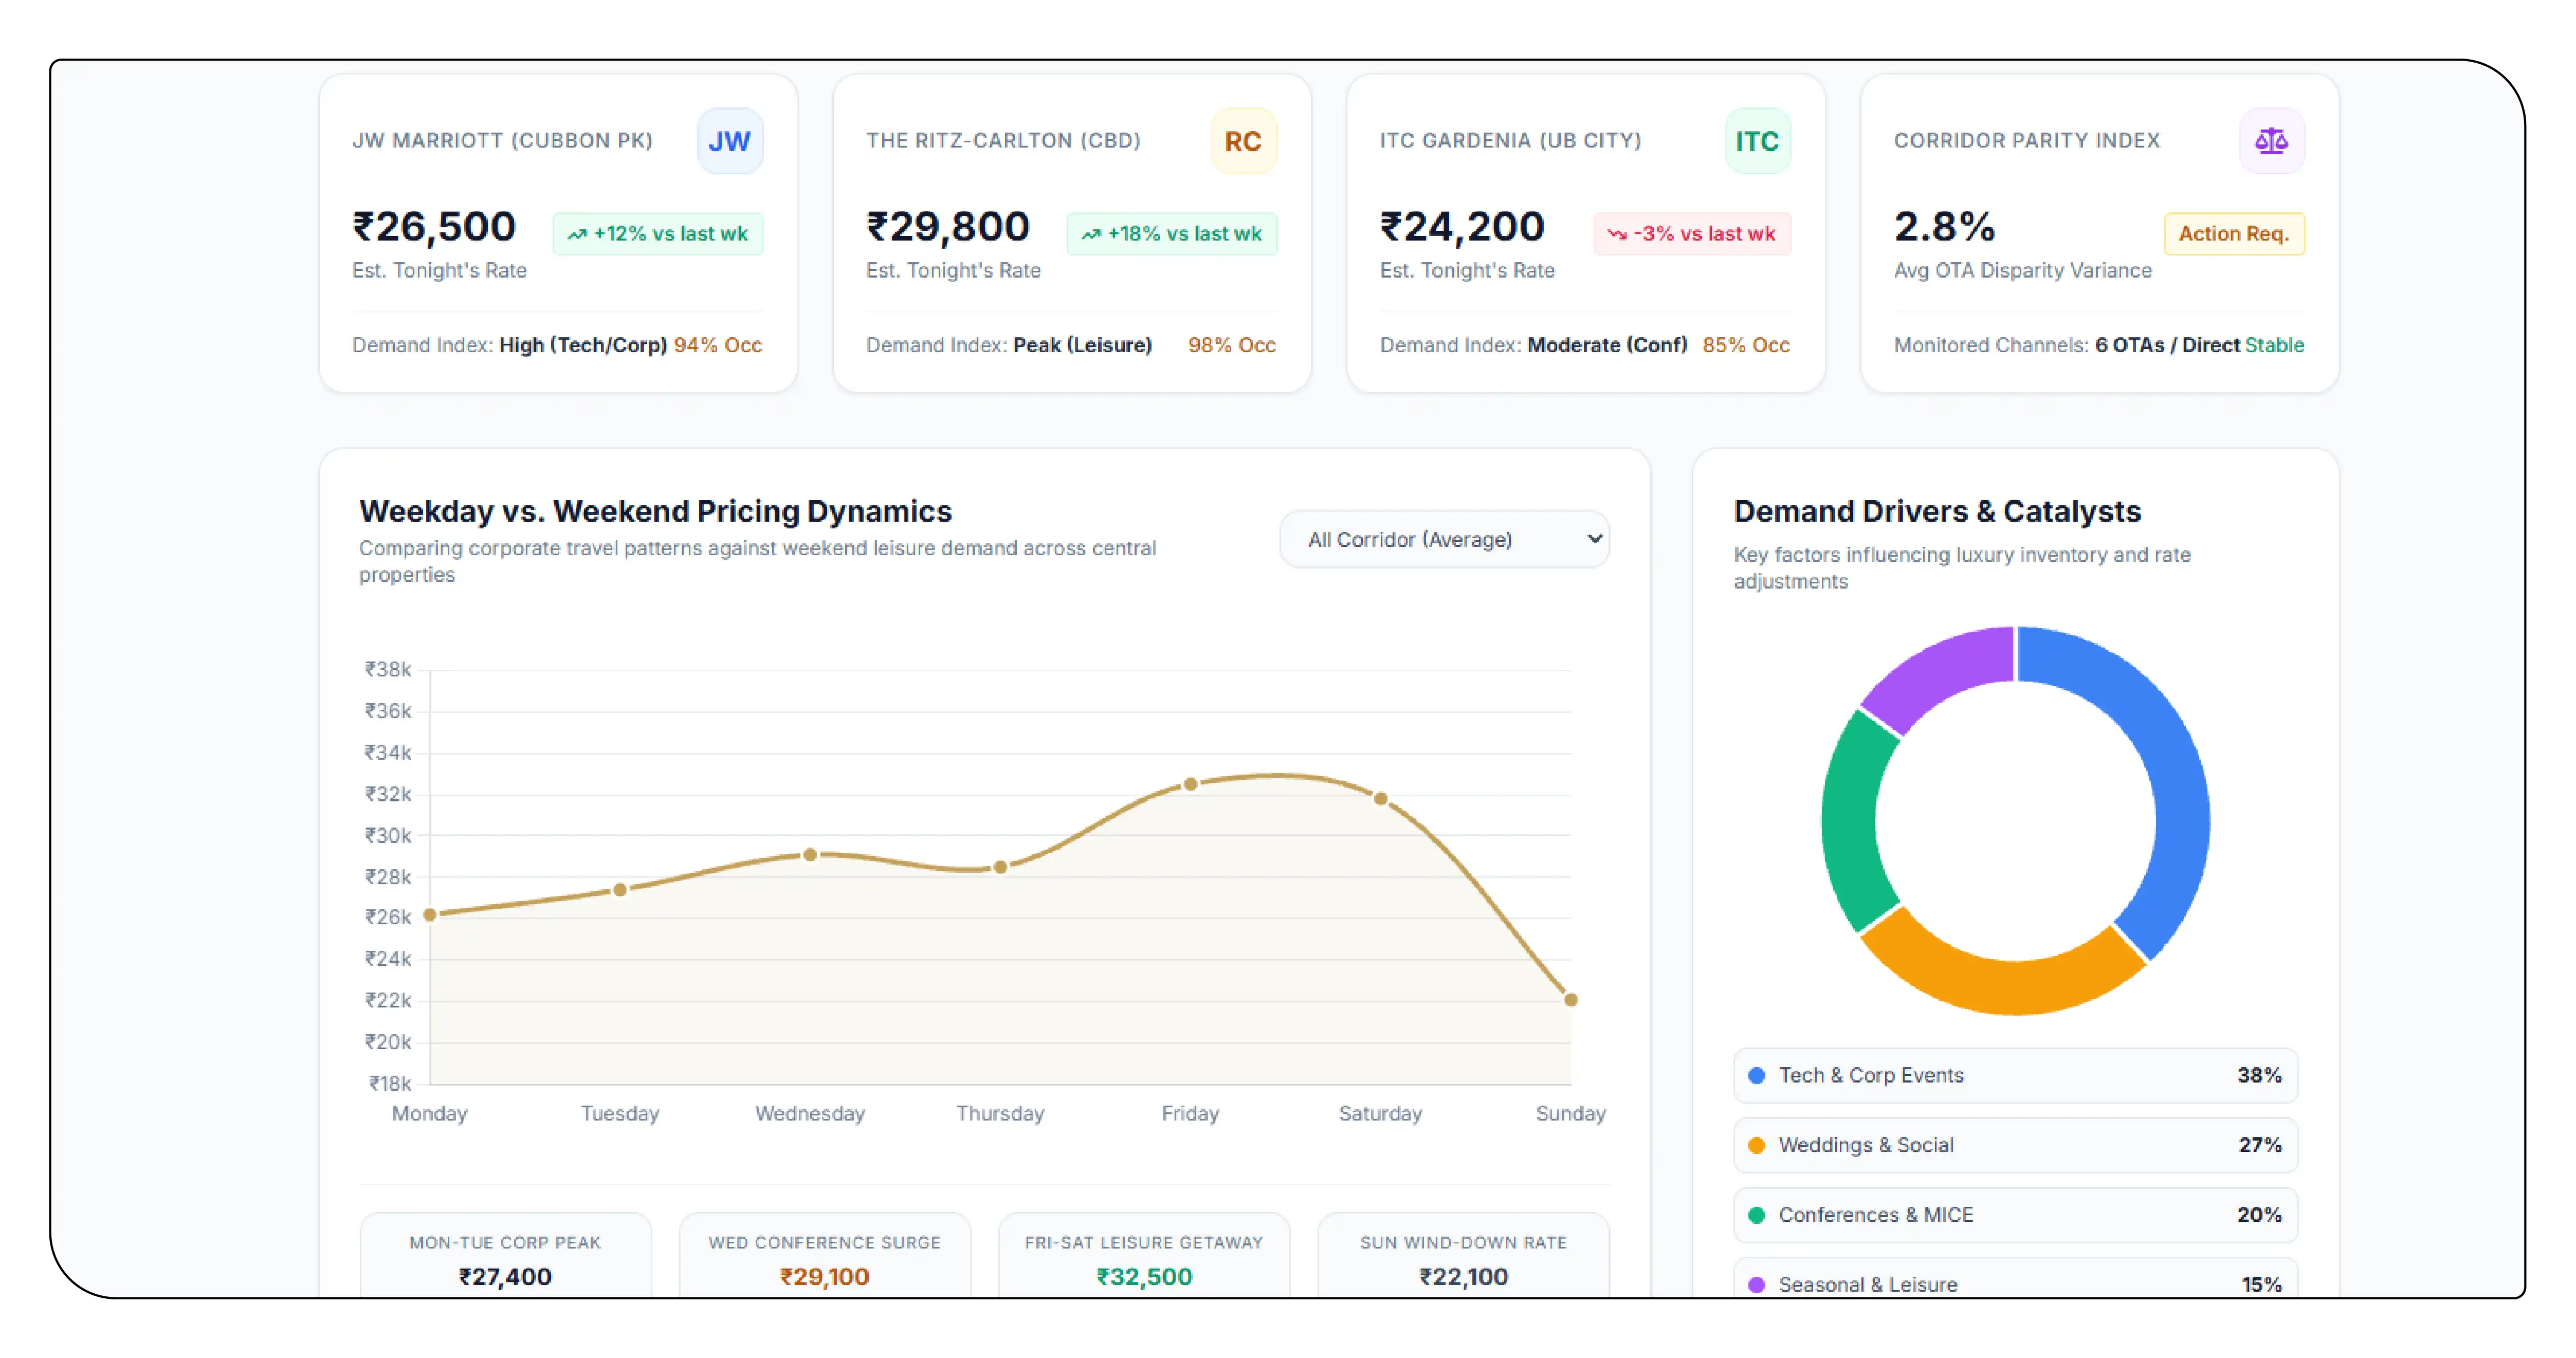
Bengaluru's central luxury hotels are concentrated around important commercial and hospitality corridors including the central business district, Residency Road, Cubbon Park, UB City, and nearby premium commercial areas.
Marriott describes JW Marriott Hotel Bengaluru as a centrally located five-star property overlooking Cubbon Park, while The Ritz-Carlton is positioned in the city's central business district. ITC Gardenia is also centrally located near MG Road and UB City.
These locations create different demand patterns. A weekday corporate booking may produce substantially different pricing from a weekend leisure booking. Conference calendars, weddings, public holidays, major technology events, and seasonal travel can further influence inventory and rates.
The result is a highly dynamic pricing environment in which parity must be monitored by date and channel rather than evaluated as a single static number.
Research Methodology
A comprehensive hotel rate-parity study can collect data at predefined booking lead times, such as 0, 1, 3, 7, 14, 30, 45, and 60 days before check-in.
For every observation, the dataset can capture:
- Hotel name
- Hotel location
- Search date
- Check-in date
- Check-out date
- Booking lead time
- Room category
- Occupancy
- Base room price
- Taxes and fees
- Final payable amount
- Breakfast status
- Cancellation policy
- Payment condition
- Booking channel
- Promotional discount
- Member/mobile rate
- Availability status
The comparison engine can then calculate absolute and percentage differences between channels.
A basic parity-gap formula is:
Parity Gap % = ((Channel Rate − Reference Rate) / Reference Rate) × 100
The reference rate can be the hotel's publicly displayed direct rate, provided that room type, occupancy, cancellation policy, inclusions, and taxes are comparable.
Illustrative Bengaluru Luxury Hotel Rate Benchmark
The following dataset is a research-model example, not a claim that these exact rates are simultaneously available. It demonstrates how a structured parity dataset can be designed.
Bengaluru Luxury Hotel Rate Comparison Dataset — Illustrative Benchmark
The following comparison organizes the provided benchmark rates across June–July 2026, highlighting weekday/weekend pricing, booking lead time, OTA differences, taxes, and parity gaps.
| Hotel | Area | Room Category | Stay Type | Lead Time | Direct Rate ₹ | OTA-A ₹ | OTA-B ₹ | Metasearch ₹ | Taxes & Fees ₹ | Breakfast | Cancellation | Parity Gap | Availability |
|---|---|---|---|---|---|---|---|---|---|---|---|---|---|
| Ritz-Carlton Bengaluru | CBD | Deluxe King | Weekday | 3 days | 42,500 | 43,900 | 44,200 | 43,900 | 7,650 | No | Flexible | +4.0% | Available |
| Ritz-Carlton Bengaluru | CBD | Deluxe King | Weekend | 3 days | 39,800 | 40,600 | 41,250 | 40,600 | 7,164 | No | Flexible | +3.6% | Available |
| JW Marriott Bengaluru | CBD | Deluxe King | Weekday | 7 days | 38,500 | 39,250 | 40,100 | 39,250 | 6,930 | No | Flexible | +4.2% | Available |
| JW Marriott Bengaluru | CBD | Deluxe King | Weekend | 7 days | 34,800 | 35,500 | 36,200 | 35,500 | 6,264 | No | Flexible | +4.0% | Available |
| ITC Gardenia | Residency Road | Luxury Room | Weekday | 14 days | 31,500 | 32,400 | 33,100 | 32,400 | 5,670 | No | Flexible | +5.1% | Available |
| ITC Gardenia | Residency Road | Luxury Room | Weekend | 14 days | 28,900 | 29,750 | 30,200 | 29,750 | 5,202 | No | Flexible | +4.5% | Available |
| Taj West End | Central Bengaluru | Luxury Room | Weekday | 7 days | 29,800 | 30,600 | 31,200 | 30,600 | 5,364 | Yes | Flexible | +4.7% | Available |
| Taj West End | Central Bengaluru | Luxury Room | Weekend | 7 days | 27,500 | 28,300 | 29,100 | 28,300 | 4,950 | Yes | Flexible | +5.8% | Available |
| The Oberoi Bengaluru | MG Road | Luxury Room | Weekday | 30 days | 36,500 | 37,200 | 38,000 | 37,200 | 6,570 | No | Flexible | +4.1% | Available |
| The Oberoi Bengaluru | MG Road | Luxury Room | Weekend | 30 days | 34,500 | 35,300 | 36,100 | 35,300 | 6,210 | No | Flexible | +4.6% | Available |
| Ritz-Carlton Bengaluru | CBD | Club Room | Weekday | 30 days | 48,500 | 49,750 | 50,600 | 49,750 | 8,730 | Yes | Flexible | +4.3% | Limited |
| JW Marriott Bengaluru | CBD | Executive Room | Weekday | 30 days | 43,200 | 44,100 | 45,000 | 44,100 | 7,776 | Yes | Flexible | +4.2% | Limited |
| ITC Gardenia | Residency Road | Executive Suite | Weekend | 14 days | 52,500 | 54,000 | 55,250 | 54,000 | 9,450 | Yes | Flexible | +5.2% | Limited |
| Taj West End | Central Bengaluru | Suite | Weekend | 14 days | 49,800 | 51,200 | 52,100 | 51,200 | 8,964 | Yes | Flexible | +4.6% | Limited |
| The Oberoi Bengaluru | MG Road | Premier Room | Weekday | 45 days | 41,500 | 42,600 | 43,500 | 42,600 | 7,470 | No | Flexible | +4.8% | Available |
This structure allows analysts to distinguish between headline-rate differences and actual customer-facing price differences.
Ritz-Carlton Bengaluru Rate Parity Monitoring
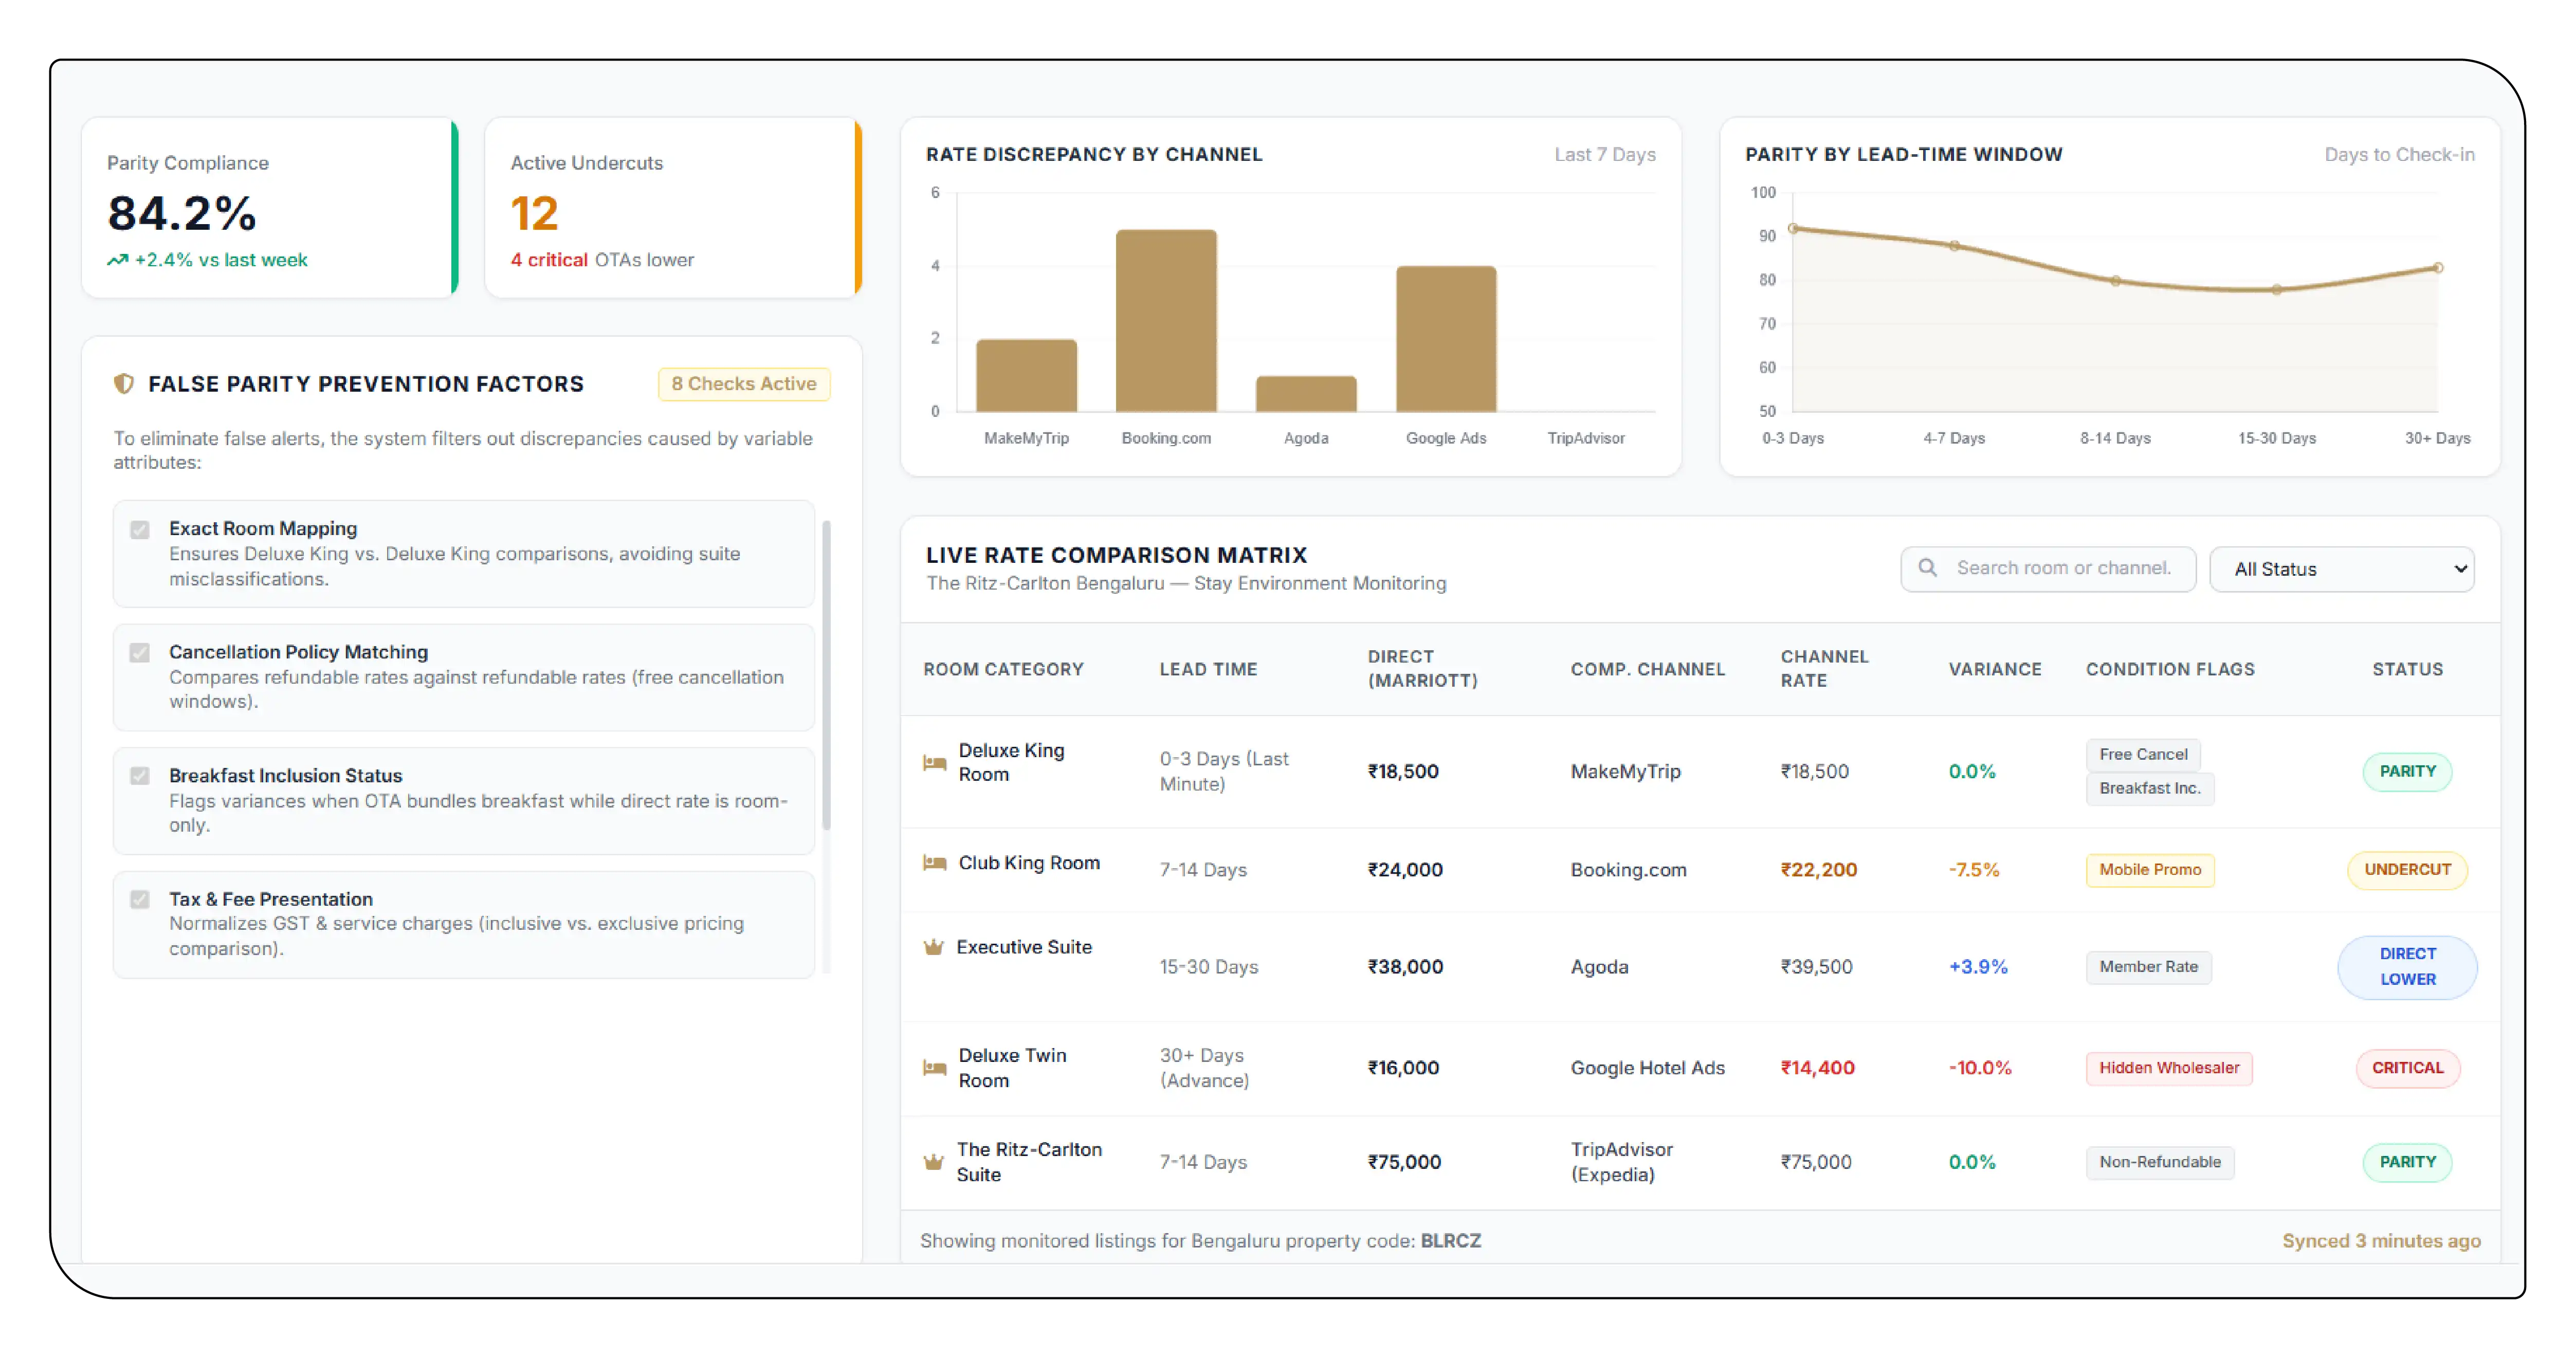
Ritz-Carlton Bengaluru rate parity monitoring can track direct website rates against OTA and metasearch listings across room categories and lead-time windows.
The Ritz-Carlton appears among Marriott's currently listed Bengaluru properties, with displayed rates varying according to the searched stay environment.
For analytical purposes, the important variables are not simply whether one channel is cheaper. Analysts should determine whether:
- The same room is being compared.
- The cancellation terms match.
- Breakfast is included on both channels.
- Taxes are presented consistently.
- A member-only rate is involved.
- A mobile promotion changes the displayed price.
- A package contains additional benefits.
- Currency conversion affects the apparent difference.
This approach prevents false parity alerts.
JW Marriott Bengaluru Hotel Pricing Intelligence
JW Marriott Bengaluru hotel pricing intelligence can reveal how rates respond to booking lead time, weekdays, weekends, room category, and inventory pressure.
Public Marriott listings currently show JW Marriott Hotel Bengaluru as a five-star city-centre property, with displayed rates changing across Marriott's hotel-search pages.
A pricing intelligence system can create a historical rate curve. For example, an analyst could monitor the same Deluxe King room at 60, 30, 14, 7, 3, and 1 day before arrival.
If the rate remains stable until seven days before arrival and then increases rapidly, the dataset can identify a late-booking price acceleration. If OTA pricing diverges simultaneously, the observation becomes relevant to parity monitoring.
Taj West End Bengaluru Booking Price Analytics
Taj West End Bengaluru booking price analytics can compare room rates across booking channels while separating room-only, breakfast-inclusive, refundable, and bundled offers.
Current OTA listings demonstrate why this distinction matters. Booking.com, for example, displays multiple rate plans for Taj West End, including breakfast-inclusive and breakfast-and-dinner options, with different cancellation and payment conditions.
Similarly, marketplace listings can apply promotions that change the effective customer price. MakeMyTrip currently displays Taj West End offers involving taxes, room packages, and promotional benefits, demonstrating the complexity of direct headline-price comparisons.
Therefore, a parity engine should compare like-for-like products instead of treating every listing as equivalent.
Hotel Data Scraping for Rate Intelligence
Hotel Data Scraping can automate the collection of publicly displayed hotel pricing information across approved sources and transform fragmented observations into structured datasets.
A typical workflow can include:
- Property Discovery: The system identifies hotels, addresses, room categories, amenities, and property metadata.
- Rate Collection: Prices are captured for predetermined check-in and check-out dates.
- Channel Normalization: The same hotel, room, occupancy, and cancellation conditions are matched across channels.
- Price Calculation: Base price, taxes, fees, discounts, and final payable amounts are calculated separately.
- Historical Storage: Each observation receives a timestamp so analysts can reconstruct pricing movements.
- Alert Generation: The system can flag differences exceeding predefined analytical thresholds.
This creates a historical pricing warehouse rather than a one-time rate snapshot.
Illustrative Booking-Lead-Time Analysis
Luxury Hotel Rate Movement by Booking Lead Time — Illustrative Dataset
| Hotel | Room Type | 60 Days ₹ | 45 Days ₹ | 30 Days ₹ | 14 Days ₹ | 7 Days ₹ | 3 Days ₹ | 1 Day ₹ | Rate Increase 60→1 Day | Occupancy Index | Demand Signal |
|---|---|---|---|---|---|---|---|---|---|---|---|
| Ritz-Carlton Bengaluru | Deluxe King | 35,900 | 36,800 | 38,500 | 40,800 | 42,500 | 45,200 | 48,600 | 35.4% | 88 | High |
| JW Marriott Bengaluru | Deluxe King | 31,800 | 33,100 | 35,000 | 36,800 | 38,500 | 41,200 | 44,500 | 39.9% | 86 | High |
| ITC Gardenia | Luxury Room | 26,800 | 27,500 | 29,000 | 30,200 | 31,500 | 34,000 | 36,800 | 37.3% | 84 | High |
| Taj West End | Luxury Room | 25,600 | 26,400 | 27,300 | 28,200 | 29,800 | 31,400 | 33,200 | 29.7% | 81 | Moderate-High |
| The Oberoi Bengaluru | Luxury Room | 31,500 | 32,300 | 33,800 | 35,200 | 36,500 | 38,900 | 42,000 | 33.3% | 85 | High |
| Ritz-Carlton Bengaluru | Club Room | 41,200 | 42,500 | 44,500 | 46,500 | 48,500 | 51,500 | 55,000 | 33.5% | 90 | Very High |
| JW Marriott Bengaluru | Executive Room | 37,500 | 38,600 | 40,100 | 41,800 | 43,200 | 46,000 | 49,500 | 32.0% | 87 | High |
| ITC Gardenia | Executive Suite | 44,500 | 46,200 | 48,000 | 50,000 | 52,500 | 56,000 | 59,500 | 33.7% | 89 | Very High |
| Taj West End | Suite | 41,500 | 43,000 | 45,200 | 47,500 | 49,800 | 52,800 | 56,500 | 36.1% | 88 | Very High |
| The Oberoi Bengaluru | Premier Room | 35,200 | 36,100 | 37,500 | 39,000 | 41,500 | 44,200 | 47,500 | 34.9% | 86 | High |
The modeled table illustrates an important concept: a parity study can be combined with demand forecasting. A hotel that shows rising rates as the stay date approaches may be experiencing tightening inventory, while a hotel maintaining stable rates may have greater availability or a different revenue-management strategy.
ITC Gardenia Hotel Demand Forecasting
ITC Gardenia hotel demand forecasting can use historical rate movements as one of several demand indicators.
ITC Gardenia's official Marriott property page describes the hotel as a five-star property in central Bengaluru near MG Road and UB City.
Demand models can combine:
- Historical room rates
- Occupancy estimates
- Search-date trends
- Booking lead time
- Day of week
- Public holidays
- Event calendars
- Room availability
- Competitor pricing
- Discount intensity
- Cancellation conditions
Public pricing data can therefore become an input into broader hospitality analytics.
Jw Marriott Hotels & Resorts Location Dataset
Jw Marriott Hotels & Resorts Location Dataset can enrich pricing analysis with property-level geographic information.
For Bengaluru, location data can include latitude and longitude, address, neighborhood, nearby business districts, airports, convention venues, commercial centers, and transport links.
When combined with pricing observations, analysts can study whether hotels closer to corporate clusters experience different rate behavior from properties farther away.
A multi-property location dataset can also support geographic segmentation across cities and countries, making it useful for hotel benchmarking programs rather than only Bengaluru analysis.
Scrape The Oberoi Bengaluru Rates by Booking Lead Time
Scrape The Oberoi Bengaluru rates by booking lead time to identify how room prices evolve from long-range planning through last-minute booking windows.
The Oberoi's published tariff page provides historical rack-rate information and distinguishes room categories such as Deluxe, Luxury, Premier, Executive Suite, Deluxe Suite, and Presidential Suite. The page also notes that displayed rack rates are distinct from Best Available Rates.
That distinction is important for data modeling. Rack rates should not automatically be treated as the same thing as the live bookable rate.
A lead-time dataset could therefore maintain separate fields for:
- Published rack rate
- Best available rate
- Promotional rate
- Member rate
- OTA rate
- Final rate after taxes
- Cancellation policy
- Meal inclusion
- Availability
This produces much more useful intelligence than simply collecting the lowest displayed number.
What a Rate-Parity Dashboard Can Reveal?
A Bengaluru luxury hotel dashboard can transform thousands of daily observations into actionable analytical views.
Channel Parity
Shows the percentage of comparable room observations where channels display equivalent effective prices.
Price Gap
Measures the absolute difference between direct and third-party channels.
Discount Depth
Tracks the difference between published pricing and promotional pricing.
Lead-Time Curve
Shows how prices evolve as the check-in date approaches.
Room-Level Variance
Identifies which categories experience the greatest price dispersion.
Tax Transparency
Separates room rates from taxes and fees to prevent misleading comparisons.
Availability Pressure
Combines room availability with price movement to identify possible demand changes.
Business Applications
Rate-parity intelligence can support several hotel and hospitality functions.
Revenue Management: Revenue teams can identify unusual channel differences and examine whether pricing rules are being applied consistently.
Distribution Management: Commercial teams can compare direct and third-party distribution behavior across multiple dates.
Competitive Intelligence: Hotels can monitor comparable luxury properties and understand market-level pricing movements.
Demand Forecasting: Historical pricing patterns can become inputs into occupancy and demand models.
Travel Analytics: Corporate travel teams can study price movement across preferred properties and booking windows.
Investment Research: Hospitality analysts can use historical pricing and availability observations to understand competitive positioning and market dynamics.
Key Metrics for a Bengaluru Luxury Hotel Parity Dashboard
A mature dashboard should monitor more than average room price. Recommended metrics include:
- Average Daily Rate
- Median Daily Rate
- Direct-vs-OTA Price Gap
- Parity Gap %
- Rate Dispersion
- Discount %
- Tax-to-Base-Rate Ratio
- Breakfast Premium
- Refundable Premium
- Weekend Premium
- Lead-Time Premium
- Room Availability
- Channel Coverage
- Rate Change Frequency
- Competitor Price Index
Together, these metrics provide a multidimensional view of hotel pricing behavior.
Data Quality and Research Limitations
Hotel pricing is inherently dynamic. A displayed price can change within minutes because of inventory updates, promotions, demand conditions, currency conversion, logged-in status, geographic targeting, or booking-session characteristics.
Therefore, parity research should preserve the exact timestamp of every observation.
The dataset should also retain the complete offer conditions. A ₹30,000 refundable room with breakfast is not directly comparable with a ₹27,000 non-refundable room without breakfast.
Another limitation is that publicly visible rates may not represent negotiated corporate rates, closed-user-group offers, loyalty redemptions, or private contracts.
For these reasons, parity analysis should be interpreted as a structured view of observable market pricing rather than a complete representation of every transaction.
Conclusion
Bengaluru's luxury hotel market provides a strong environment for continuous rate-parity research because premium properties operate across direct websites, OTAs, metasearch platforms, loyalty programs, mobile channels, and promotional distribution systems.
A structured rate-parity dataset can move analysis beyond simple price collection by connecting room category, booking lead time, cancellation terms, taxes, inclusions, availability, geography, and channel information.
Oberoi Hotels & Resorts Hotel Location Dataset can further extend this framework by connecting hotel pricing observations with property locations, competitive sets, geographic segments, and historical booking patterns.
Ultimately, a well-designed Bengaluru luxury hotel intelligence system can provide a historical evidence base for understanding rate dispersion, channel behavior, booking-window movements, and competitive pricing dynamics across the city's premium hospitality market.
Ready to elevate your travel business with cutting-edge data insights? Scrape Aggregated Flight Fares to identify competitive rates and optimize your revenue strategies efficiently. Discover emerging opportunities with tools to Extract Travel Website Data, leveraging comprehensive data to forecast market shifts and enhance your service offerings. Real-Time Travel App Data Scraping Services helps stay ahead of competitors, gaining instant insights into bookings, promotions, and customer behavior across multiple platforms. Get in touch with Travel Scrape today to explore how our end-to-end data solutions can uncover new revenue streams, enhance your offerings, and strengthen your competitive edge in the travel market.
Unlock the Full Report
Enter your details to access premium pricing intelligence insights